The following graphs are based on demographic data taken from 7 opinion polls conducted between January and April 2018 – the Overall average is based on the last 4 opinion polls (conducted in March and April) where the individual demographic figures are weighted to that average.
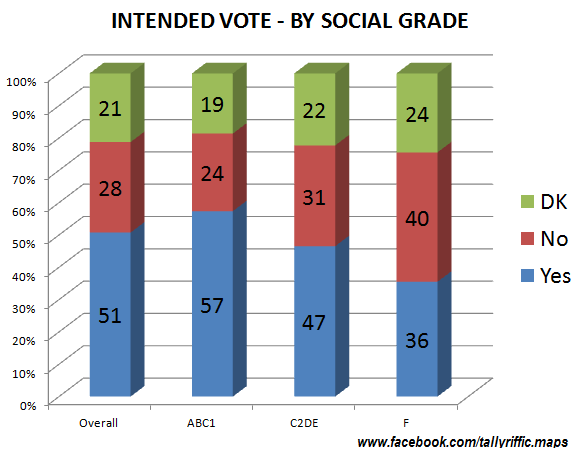
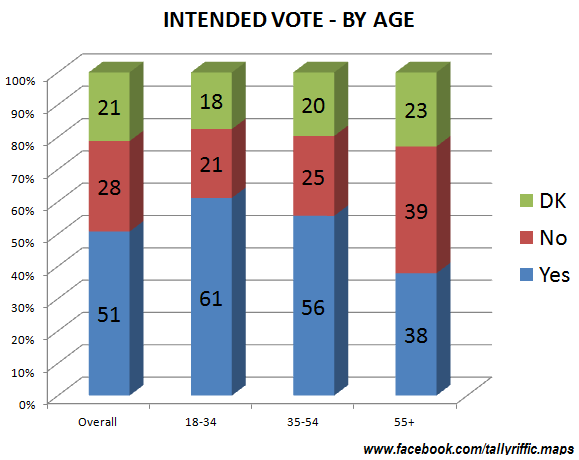
Overall the Yes vote is at 51%, with the No Vote at 28% and Don’t Knows at 21%. If the Don’t knows split like they did in the Marriage Referendum, there would be a Yes Vote win by 55% to 45% – Dublin Voters (63% Yes), Young Voters (63%), Middle-Class voters (60%) and Labour Voters (65%) being strongly in favour. By Contrast, a majority of Connaught-Ulster voters (54% No), Older Voters (59%), Working-Class voters (51%), Farmers (61%) and Fianna Fáil voters (53%) would vote against the proposal.
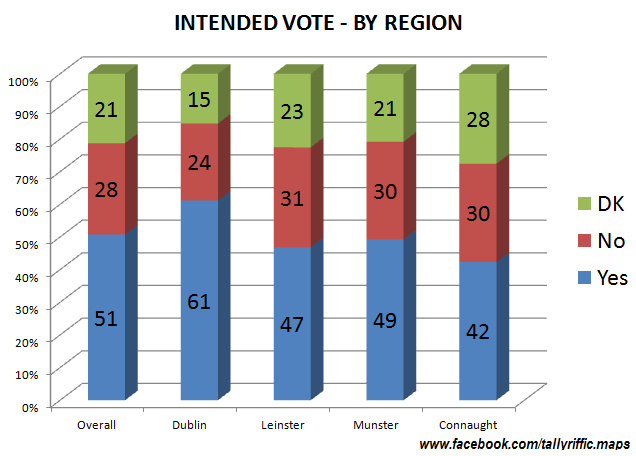
In this graph, it can be seen that among Dublin voters who declare an intention Yes voters outnumber No voters by 3 to 1 – or a lead of 37%. By contrast, in Connaught-Ulster the Yes lead is only 12%.
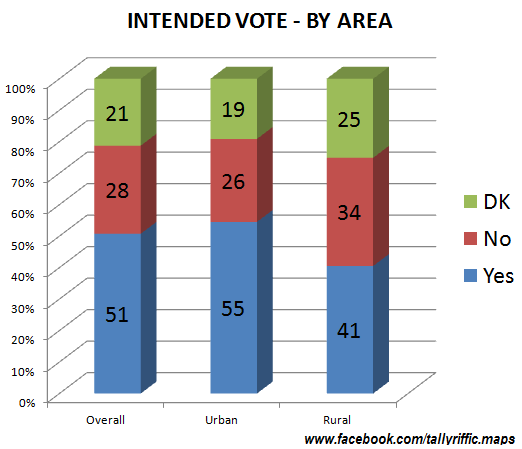
This divide between Urban and Rural Ireland can be further seen here.
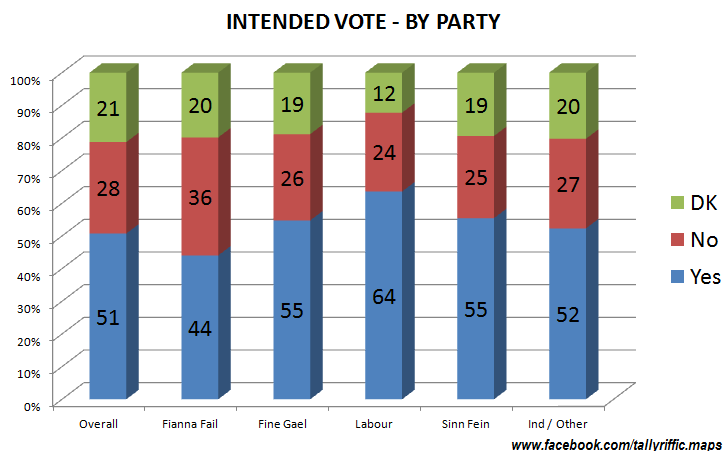
Yes is at over 50% amongst all parties bar Fianna Fail where the Yes vote enjoys a lead of only 8% – by contrast the Yes Vote enjoys a lead of 29% and 30% amongst Fine Gael and Sinn Féin supporters – who may be polar opposites socially and ideologically but seem to be on common ground on this issue at least.
According to the polls, the main divide is between those aged under 55 (where Yes enjoys a lead of over 30%) and those over 55% where the Yes and No vote is essentially tied.
Finally, the Yes vote has a 33% lead amongst Middle-Class voters, but only a 16% lead amongst working-class voters, and is actually behind amongst farmers.