KO refers to the Civic Coalition, a centrist coalition of several parties established in 2018. The main ones are the Civic Platform, founded in 2001, which is a moderately Liberal pro-European centre-right party, and Modern, which is a Liberal pro-European Right-Wing parry. It aligns with the Renew Europe Group in the European parliament. Their candidate was Rafal Trzaskowski, former Mayor of Warsaw.
PiS refers to Law and Order, a populist right-wing party founded in 2001.it is categorised as a Conservative Eurosceptic left-populist party. It aligns with the European Conservatives and Reformers group in the European Parliament. Its candidate was Karol Nawrocki, a historian.
KWIN refers to Confederation Liberty and Independence, an economically Liberal Hard Right Electoral alliance between the New Hope and National parties established in 2018. It aligns with the Patriots for Europe and European Social Network in the European Parliamebt. Its candidate was Tax Advisor, Slawomir Mentzen.
KKP refers to the Confederation of the Polish Crown which is an ultra-conservative party founded by Grzegorz Braun in preparation for his participation in this election. Essentially a vehicle for Braun who is known for extremist comments and actions such as destroying a Jewish Menorah which had been erected in the Sejm (Polish Parliament)
TD refers to Third Way, a mildy conservative centrist alliance of Poland 2050 and the Polish Peoples Party formed in 2023. It aligns with the European Peoples Party and Renew in the European Parlianent. Its candidate was Syzmon Holownia, a former Television Personality.
RAZEM is a Progressive Social Democratic party founded in 2015. It was originally a member of The Left coalition but left in 2024 over disagreements about supporting Donald Tusk’s government. It’s candidate was Adrian Zandberg, a computer programmer.
NL refers to The Left, a centre-left Liberal coalition of six small left-wing parties, the most prominent of which is probably New Left. Its candidate was Magdelena Biejat who was originally a member of RAZEM but remained with The Left in the 2024 split.
VOTE BY GENDER
Below are results from the exit poll showing the Results by Gender. The top three parties listed would be likely supportive of Nawrocki (PiS), the other four of Trzaskowzi (PO).
PARTY
MALE
FEMALE
PiS
29
31
CON
20
10
CPC
8
5
Nawrocki
55
46
KO
28
35
TD
4
5
RAZEM
4
6
NL
2
6
Trzaskowzi
39
51
GENDER BREAKDOWN
In the first round the two main candidates were roughly equal amongst men, but Trzaskowzi held a small lead amongst women. However, the far-right parties (Confederation and Confederation of the Polish Crown) were much more popular amongst men (28% to 15%) than women. Amongst the smaller Trzaskowzi-leaning parties, they received 17% from females but only 10% from Males.
VOTE BY AGE
PARTY
18-29
30-39
40-49
50-59
60+
PiS
11
20
27
36
45
CON
35
25
11
8
3
CPC
5
10
9
6
3
Nawrocki
51
54
47
50
51
KO
13
22
34
27
43
TD
4
7
7
5
2
RAZEM
19
5
2
2
1
NL
5
6
5
4
2
Trzaskowzi
41
40
49
47
47
AGE BREAKDOWN
The real story here is not the age disparity in support between the two blocs, but rather the vote disparity within the two blocks. For instance amongst the youngest voters Confederation outpolled PiS more than 3 to 1; amongst the oldest PiS outpolled them by 15 to 1. Similarly KO were outpolled by 19% to 13% against the centre-Left Razem but were dominant amongst the oldest voters.
VOTE BY EDUCATION
PARTY
PRIM.
2nd-L
VOC.
3rd-L
PiS
52
49
30
20
CON
13
13
17
13
CPC
6
7
7
5
Nawrocki
71
70
54
38
KO
16
22
29
39
TD
3
3
4
7
RAZEM
5
1
6
6
NL
2
2
3
6
Trzaskowzi
26
28
42
57
EDUCATION BREAKDOWN
Nawrocki (PiS) leads strongly amongst voters whose education didn’t go beyond 2nd level, taking roughly half the vote with another one fifth going to the Far-Right Confederation parties. Trzaskowski led Nawrocki by 2 to 1 amongst voters with a 3rd level education.
VOTE BY SETTLEMENT TYPE
PARTY
RURAL
TOWN
S.CITY
M.CITY
L.CITY
PiS
38
30
24
19
18
CON
17
14
13
11
11
CPC
8
7
6
4
4
Nawrocki
63
50
43
34
32
KO
22
34
38
43
41
TD
5
5
5
6
5
RAZEM
3
4
5
7
10
NL
3
4
5
6
7
Trzaskowzi
33
46
53
61
62
LOCATION BREAKDOWN
Nawrocki only led Trzaskowni amongst rural voters (38% to 22%) but in composite support he bested Trzaskowni narrowly in town areas. The latter was well ahead in cities, particularly large cities.
VOTE BY OCCUPATION
PARTY
MANAGER
ADMIN
WORKER
FARMER
STUDENT
UNEMPLOYED
PiS
17
24
37
52
10
34
CON
15
16
22
14
26
18
CPC
5
8
11
10
4
9
Nawrocki
37
47
69
77
41
61
KO
37
30
17
12
16
20
TD
7
6
4
4
5
6
RAZEM
5
6
3
1
25
6
NL
7
6
2
2
6
4
Trzaskowzi
57
49
26
19
52
35
OCCUPATION BREAKDOWN
The Breakdown of Occupational support suggests the parties likely to support Trzaskowzi tended to be more middle-class (Managers 57%, Administrators 49%) than working-class. On the other hand, parties likely to support Narwocki received very strong support from Farmers (77%), ordinary workers (69%) and the unemployed (61%).
Support was more mixed amongst Students (Trzaskowzi bloc 52%, Narwocki bloc 41%) but the real story here was that neither PiS nor the Civic Coalition topped the poll – instead the left-wing Razem party and the Far-Right Confederation took a quarter of the student vote each. There was a similar pattern in the 18-29 age group with Confederation taking over a third of the vote and Razem taking a fifth.
COMMENTARY
This IPSOS exit poll gives a fascinating insight into the coalitions of support for what might be called the Conservative/Populist Bloc (Law and Order, Confederation, Confederation of the Polish Crown) on one side and a Liberal/Left Bloc (Civic Coalition, Third Way, New Left, RAZEM) on the other.
At a bloc-level, the major differences can be seen in the Occupational, Residential and Educational (Conservative/Populists well ahead amongst ordinary workers and farmers, rural dwellers and no post-secondary education – Left/Liberals ahead amongst higher occupational grades, city-dwellers and Graduates) poll results.
Bloc support is more muted by Gender with Conservative/Populist parties leading by just under 10 points with Males, and Liberal/Left parties leading by just over 10 points with Females – however the female deficit on the Conservative/Populist side is almost totally due to the huge gender gap in votes for the Confederation candidates – they attracted the support of 28% of Male voters but only 15% of Fenale voters.
On the surface, it appears that there is remarkably little preferential difference amongst the Blocs across the age groups. However here it might be better to look not at ideological differences but rather a cleavage between the “Establishment” parties who have wielded power (ie Law and Justice and Civic Coalition) and the other contenders. The Establishment parties together take only a quarter of the votes of the youngest voters, but nearly 90% of votes of the oldest. The two Confederation candidates took 40% of the vote amongst voters under 30, the left-wing parties took 25% (mainly RAZEM). The growth in Confederation’s vote – and its strong support amongst the young – suggests it could be well-placed to challenge PiS for dominance on the right.
It is also worth noting that Law and Justice’s strong vote amongst voters who did not progress beyond secondary schooling, might seem to be related to the pattern of their age support, but paradoxically the Civic Coalition – who were also disproportionately supported by older voters – did best amongst voters with a third-level education. What seems simple to the naked eye might be somewhat more complicated. The smaller liberal/left parties also did best amongst the third-level educated.
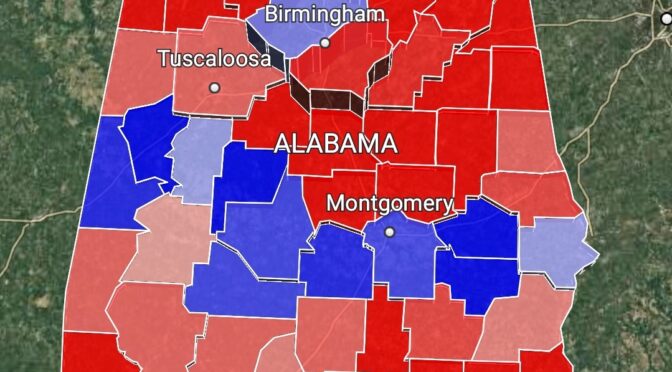
This post will use maps and Analysis to look at the results of the 2024 US Presidential Election in Alabama on a County basis.
We will be looking at the results on the basis of income, specifically the percentage of families which have an income of less than $35k per year.
I’m dividing the analyses into four sections:
Less than ⅙ of households earn less than $35k per year
Between ⅙ and ⅓ of households earn less than $35k per year
Between ⅓ and ½ of households earn less than $35k per year
Over ½ of households earn less than $35k per year
Each map will show all counties in Alabama but those that don’t fit the Census criteria are transparent and appear Darker.
The colours Red and Blue are used to indicate the Republican and Democrat leads respectively – the darker the shade the greater the lead. The darkest shade indicates leads of 50% or more.
The only county where less than one-sixth of Households have an income of $35,000 or less is Shelby County, which includes the southern suburbs of Birmingham as well as affluent exurbs clustered along Interstate Highway 65 as well as a large number of Golf courses. The median family income in 2010 was just over $68gK. The proportion of White households decreased from 89% to 73% between 2000 and 2020 with corresponding rises in both Black and Hispanic households. The County voted reliably for Denocrats between 1868 and 1944 – except in 1928 when there was a backlash in the Southern Sates against Irish Catholic Democrat candidate Al Smith. Dixiecrats Strom Thurmond and George Wallace won in 1948 and 1968 respectively amidst a period of Republican dominance from 1956 until 2004 – since then the county has become Democrat-leaning.
Most of the counties where low-income households comprised between one-sixth and one-third of households voted Republican (23) versus only 2 for the Democrats – Montgomery and Jefferson. Jefferson is home to the city of Birmingham and its many suburbs. Birmingham was historically a white majority city but from the 1960s onward “White Flight” to the suburbs saw a marked decrease in both the city’s population and its white population share. The 2020 census shows that the city’s population continued to decline and had fallen by neatly half since its peak in 1960, but conversely the white share of the population increased marginally from 21% to 23%, while the Black share of the population fell from 73% to 68%. Birmingham was the scene of high levels of activity by the Ku Klux Klan in the 1950s, which served as a spur for the city to be an 8mportanr center of the Civil Rights movement in the 1960s. In the broader county the White share of the population fell to under half for the first time, possibly due to a small but growing Hispanic community.
In Montgomery City, there has been a rapid departure of White families from the city – in 2000, the White and Black populations was roughly equal, by 2020 the black population outnumbered their white counterparts by more than two to one. Montgomery City dominates Montgomery Coubty comprising over 80% of its population. Montgomery County was very much part of the Democratic “Solid South” from 1900 to 1944, with the Democratic vote frequently rising over 90% – however Dixiecrat Strom Thurmond won 88% of the vote in 1948; and fron 1956 until 1992 (except in 1968 when George Wallace won), the Republicans won every Presidential vote. Since then the county has fallen back into the Democratic column.
Counties where between a third and a half of Households earn less than $35k per year constitute most of the rural counties of the rural Black Belt which runs horizontally across south-central Alabama. Though taken these days as a reference to the group of rural counties with Black majorities, the term “Black Belt” originally referred to the fertile black soil that ran across this section of Alabama that made it especially suitable for Cotton cultivation which led to a large population of Black enslaved people across the Black Belt. Two typical counties in the east of the Black Belt are Macon and Bullock county.
Macon County was only established in 1832 and originally populated largely by slaveholders (and slaves) from further east. The population collapsed by one-third between 1860 and 1870 as newly freed ex-slaves went north to the cities or west to the frontiers in search of work and opportunity. The population gradually recovered reaching a peak of thirty thousand in 1950, but has been in near continuous decline since then, falling under twenty thousand in 2020. The Black population has fallen by nearly a quarter since 2000. In the same year, the average family income was only $21k. The Democratic Party only failed to win Presidential elections in Macon County three times since 1900 – in 1948 when Strom Thurmond ran as a Dixiecrat, in 1956 when Dwight Eisenhower won a narrow victory and in 1964 when electors pledged to George Wallace (who pulled out of the race) took a majority. Interestingly turnout in 1960 was 2,229 votes (Democrat vote 59%) compared to 6,381 votes (Democrat vote 69%), suggesting a massive enrolment of Black voters in the intervening years and a near seemless transition of the local Democratic Party from Dixiecratic to modern Democratic.
Bullock County – which lies directly to the south of Macon County – began to see development of cotton plantations from the 1830s (which involved clearing the forests that dominated the landscape as well as the native American Creek tribe), but wasn’t given County status till after the civil war. The cotton-eating Boll Weevil arrived in the County in 1877, eventually destroying the Cotton industry. The population peaked at just under thirty-two thousand in 1910 after which it entered a nearly continuous decline and by 2020 it was barely over ten thousand. Similar to Macon County, Bullock County was part of the Solid South with the Democratic Party thrice winning over 99½% of the vote – in 1904, 1920 and 1936 – in Presidential elections. Turnout figures – and voting patterns – suggest that between 1896 and 1904, the Democratic Party significantly reduced the franchise to remove most Black voters from the register. The Republicans took about a third of the vote in 1884 and 1888, the Progressives 43% in 1892. In that year over thirty-three hundred voters cast ballots – in 1904 only seven hundred did. As you might expect, Strom Thurmond won in 1948 and George Wallace in 1968. Barry Goldwater in 1964 was the only Republican win in the 20th century. Turnout increased from 1,169 votes in 1960 to over four thousand votes in 1972 when Nixon lost narrowly to George McGovern – no Presidential race since has been close. Similar to Macon County, household income was only just over $20k in 2000.
Finally, only two counties had in excess of more than 50% of households living on less than $35k per year. Greene County saw violent suppression of the Republican party by the KKK during the Reconstruction with four Republican politicians (black and white) killed in two years. Despite this, Republicans won Presidential votes until 1888. In the 1870s turnout was roughly three thousand and seven hundred per Election with the Republicans winning with roughly two thousand five hundred votes. By 1904, the Republicans won only 17 votes out of 494 cast. Strom Thurmond won in 1948 and Barry Goldwater in 1964; but since it has been a Democratic bastion. The population peaked at over twenty-four thousand in 1900 – it was just under eight thousand in 2020. Blacks outnumber Whites by Five to One. Perry County has a very similar history to Greene’s with the county losing three quarters of its population since 1880 – they both have very high obesity levels.
The following map uses Height to represent population size
Level 1 – Counties with less than ten thousand voters
Level 2 – Counties with between ten thousand and a hundred thousand voters
Level 3 – Counties with between a hundred thousand voters and a Million voters
Level 4 – Counties with over a million voters.
There are no Level 4 counties in Alabama. There are three major cities in Alabama – Mobile (Mobile and Baldwin counties), Huntsville (Huntsville County) and Birmingham (Shelby and Jackson counties).
This post will track the progress of my LEA maps for the 2024 General Election.
FIANNA FÀIL
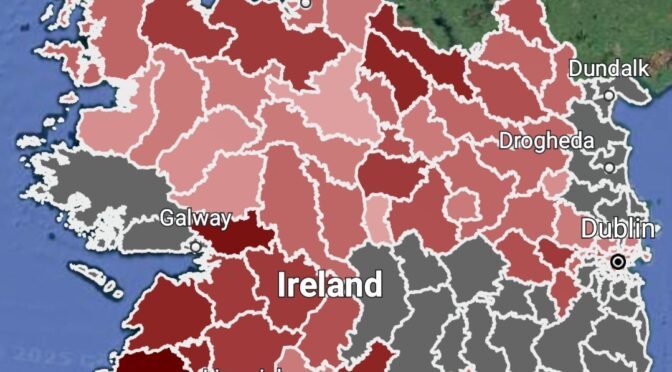
Fianna Fáil took 21.9% of the vote.
Below is the Fianna Fáil vote across the country. The darker the colour, the greater the vote strength. Darkest Red is over 36%.
The darker red up in Donegal is Pat The Cope Gallagher’s impressive vote in Glenties, where he outpolled Pearse Doherty by 37% to 35%. In Clare, Fianna Fàil polled very well across the Constituency, peaking at 47% in Ennistymon. Just to the north Albert Dolan polled well in south-east Ga
Below are close ups of the Fianna Fàil vote in Dublin and Waterford.
DUBLIN
WATERFORD
In Dublin (thus far), the highest Fianna Fáil vote was in Castleknock (25%), followed by Donaghmede (21%).
In Waterford, Fianna Fáil did best in the rural West.
FINE GAEL
Fine Gael polled particularly well in Westport (46%) and Castlebar (44%) in Mayo, Granard (52%) in Longford, Mullingar (41%) in Westmeath and Killaloe (39%) in Clare.
DUBLIN
WATERFORD
In Dublin, Fine Gael tended to do better in more middle-class areas, peaking at 34% in Pembroke.
SINN FEIN
As has historically the case, Sinn Féin support was accentuated along the border – 46% in Lifford-Stranorlar, Carndonagh and Carrickmacross-Castleblayney, 53% in Buncrana, and 45% in Monaghan.
DUBLIN
WATERFORD
Sinn Féin support was accentuated in the more working-class parts of Dublin – 36% in Ballyfermot-Drimnagh and Ballymun-Finglas, 33% in Blanchardstown-Mulhuddart.
Sinn Féin polled very well in Waterford, peaking at 55% in Waterford City South.
Clare returned 2 Fianna Fáil TDs (Timmy Dooley and Cathal Crowe), 1 Fine Gael TD (Joe Cooney) and 1 Sinn Féin TD (Donna McGettigan). Cooney replaced retiring Fine Gael TD Joe Carey (whose sister Caitriona Carey fell short), while McGettigan replaced Independent (ex-SF) Violet Anne Wynne.
For the purposes of this analysis I’ve split the Constituency into four parts : Shannon EA in the south-east, largely rural Killaloe in the East, Ennis in the centre of the county, and the Ennistymon and Kilrush areas jointly in the west. Despite covering a large geographic area, the west did not elect a TD – on the other hand Shannon elected two.
The Shannon is one of the more unusual in the country. At one end is Shannon itself, a new town largely built in the 1960s and 1970s which had always had distinct voting patterns and where Sinn Féin have a strong base. At the other end is Shannon Banks, containing suburbs of Limerick City on the Clare side of the river. And in between are rural areas and small villages such as Meelick and Parteen.
Below are the poll-toppers in the largest urban areas in Clare.
The election in Clare was effectively over on the first count – the only possible contest was between Cooney and Carey for the Fine Gael seat. In the event, Cooney was 2,324 votes ahead on the first count and 2,328 on the sixteenth.
CANDIDATE
ENNIS
SHANNON
KILLALOE
WEST
Dooley (FF)
23%
9%
22%
20%
Crowe (FF)
11%
29%
8%
10%
McGettigan (SF)
12%
22%
9%
9%
Cooney (FG)
7%
8%
34%
6%
Carey (FG)
15%
9%
4%
7%
FF Toral
36%
39%
31%
43%
FG Total
25%
18%
39%
21%
TDS AND RUNNERS-UP
DOOLEY (FF) polled well and fairly evenly across the north of the Constituency. His best polling station in Ennis was Scoil Chriost Ri in the west of the town where he took roughly a quarter of the vote. Rurally, he polled best in Dromindoora (41%) and Mounshannon (47%) in the north-east of the county – but also polled about a third of the vote in the vicinity of the Burren.
CROWE (FF) by contrast saw his vote highly concentrated in the Shannon Ekectoral Area – nearly half his vote came from here. He took 44% in Shannon Banks (an extension of the Limerick suburbs), 49% in Meelick and 46% in Parteen.
McGETTIGAN (SF) took 40% in Shannon, peaking at 45% in the St Senan’s boxes. She also took a quarter of the vote in the Shannon Banks boxes. In Ennis she took 14%, peaking at roughly 20% in Scoil Chriost Ri.
COONEY (FG) took over half his vote from his home Killaloe area in the east of the County. He took over half the vote in Annaghneal, Bodyke, Kilkishen and O’Callaghan’s Mills all of which lie on or near to the Ennis-Portumna Road. His running-mate Caitriona CAREY took 15% in the Ennis area (35% in Clarecastle), but failed to get traction elsewhere.
TIPPERARY NORTH
Tipperary North returned 1 Fianna Fáil TD (Ryan O’Meara), 1 Labour TD (Alan Kelly) and 1 Independent TD (Michael Lowry)
The reconstituted Tipperary North consists of the whole of Nenagh, Newport, Roscrea and Thurles Electoeal Areas as well as parts of Cashel-Tipperary Electoral Area and Castlecomer Electoral Area in Kilkenny.
The majority of the population live in the Eastern part of the constituency but two western candidates were elected (O’Meara and Kelly) out of the three seats.
For the purposes of this analysis I’ve split the Constituency into four parts : Nenagh, Newport, Roscrea and Thurles (including the parts of Cashel-Tipperary and Castlecomer).
Below are the poll-toppers in selected polling stations in the Constituency.
Lowry took a majority of his vote from the east of the constituency while both O’Meara and Kelly took a majority of theirs from the west. O’Meara was able to stay ahead of his running-mate Smith by outpolling him in Thurles.
CANDIDATE
NENAGH
N’PORT
R’CREA
THURLES
Lowry (IND)
19%
14%
33%
39%
Kelly (LAB)
27%
33%
4%
4%
O’Meara (FF)
23%
12%
6%
9%
Smith (FF)
4%
6%
30%
7%
TDS AND RUNNERS-UP
LOWRY (IND) polled very well across the Constituency, although he only came second in Thurles to Jim Ry an (29% to 40%). He took over half the vote in Barnane (52%), Drom (55%), Borrisoleigh (51%), Ballycahill (55%), Drumbane (52%), Gaile (65%), Inch (53%), Annacarty (52%) and Clonoulty (55%). Even in Carlow he took over 40% in Galmoy (44%), Crosspatrick (44%) and Johnstown (43%).
KELLY (LAB) has the art of finite vote management down to a fine tee – 89% of his vote was concentrated in the two Western Electoral Areas of Nenagh and Newport. He took 42% in Nenagh Town, a strong performance given the pressure from O’Meara. He also took sizeable polls in Newport (34%), Lissenhall (47%), Portroe (61%) and Silvermines (40%).
O’MEARA (FF) took healthy polls in the rural north-west in Cloughjordan (37%), Ballinree (45%) and Kilruane (33%). He also took 20% in Nenagh.
Of the other Candidates, SMITH (FF) took a very strong 47% in Roscrea, but was unable to extend his influence far beyond the town – the rest of his strong boxes were within walking distance. RYAN (IND) took a very strong poll (40%) in Thurles, but again he failed to progress much beyond the town boundaries.
TIPPERARY SOUTH
The newly reconstituted Tipperary South returned 1 Fine Gael TD (Michael Murphy) and 2 Independent TDs (Mattie McGrath, ex-FF and Seamus Healy, ex-WUAG)
Two of the three seats were effectively decided on the first count – Mattie McGrath was nestled in just under the quota while Clonmel-based Michael Murphy was comfortably ahead of Imelda Goldsboro (FF) to take the one certain Government seat.
Outgoing SF TD Martin Browne was just under half a quota, a mere 142 votes ahead of veteran socialist Seamus Healy. Just over fifteen hundred votes belong to five candidates (including Aontu, the Greens and the National Party) were distributed on the second count closing the gap to 139 votes. On the third count, just under two thousand Labour votes were distributed, closing the gap further to 75 votes. On the fourth count, just under four thousand votes belonging to Tipperary-based Independent were distributed narrowing the gap further to just 36 votes.
The only distributable votes remaining was Mattie McGrath’s surplus of 322 votes which originated from the multiple eliminations on the first count. Of these, 169 (53%) went to Healy, 54 (17%) went to Browne, 52 (16%) to Goldsboro and 47 (14%) to Murphy – leaving Healy 79 votes ahead.
Given that a fair amount of those first preferences went originally to right-leaning minor it might seem odd that they would decisively favour the most left-wing candidate in the field (particularly as they arrived via Mattie McGrath) – but perhaps it is better to look at the above transfer through an Establishment-Opposition prism. With Sinn Féin being considered by this particular strand or niche of voter as being very much part of the Establishment.
Browne’s transfers took Healy well ahead of Goldsboro for the last seat.
Poll-toppers in the West of the Constituency
Poll-toppers in the east of the constituency
Below are the performances of the candidates in each of three regions (West includes the Cahir and Cashel-Tipperary areas)
CANDIDATE
WEST
CLONMEL
CARRICK-ON-SUIR
McGRATH (IND)
32%
21%
14%
MURPHY (FG)
16%
33%
14%
HEALY (IND)
4%
21%
16%
BROWNE (SF)
12%
11%
14%
GOLDSBORO (FF)
11%
7%
28%
O’HENEY (IND)
18%
1%
1%
TDS AND RUNNERS-UP
Just under half the votes were cast in the West, just over a quarter in Clonmel Area and just under a quarter in Carrick-on-Suir area.
McGRATH (IND) polled best in the largely rural Cahir area in the south-west where he took 47%. He took 62% in Newcastle, 59% in Duhill and 52% in Goatenbridge near the Waterford border. He also polled a third of the vote in the village of Dundrum, site of a long-running protest against immigrant accommodation. However, it should be noted that he took a decent vote right across the Constituency.
MURPHY (FG) took an impressive one-third of the vote in the Clonmel Area – all the more so given that he had to go toe-to-toe with Seamus HEALY (IND) in his stronghold in the town. Even there it was 32% to 24% in Murphy’s favour. He had telegraphed his strength by taking two quotas (29%) in June’s local elections. He also took 47% in the rural Powers town Polling Station.
However what is intriguing is the wide range of his voting strength in individual boxes in the town – sometimes even between boxes in the same polling station.
I’ve given a few examples in the table below :
BOX
Murphy (FG)
Healy (IND)
Browne (SF)
Res Hall 2
40 (15%)
99 (38%)
55 (21%)
Res Hall 3
145 (48%)
55 (18%)
27 (9%)
Raheen Rd TS 1
51 (23%)
80 (36%)
29 (12%)
Raheen Rd TS 2
70 (41%)
35 (20%)
13 (8%)
Sisters of Charity 1
21 (12%)
88 (49%)
23 (13%)
Sisters of Charity 4
61 (41%)
27 (18%)
9 (6%)
RESULTS IN SELECTED CLONMEL BOXES
Note not only does the Healy vote fall in roughly inverse proportion to the Murphy vote, but so does the Browne vote. I would be tempted to say this is likely related to underlying socio-economic factors though of course there could be more specific local factors as well.
His best polls in the town were in the Presentation Convent (43%) and St Peter and Paul’s (40% but over half in two boxes). His lowest polls were St Mary’s (24%) and St Oliver Plunketts (21%)
HEALY (IND) saw his vote heavily concentrated in the towns of Clonmel (24%) and Carrick-on-Suir (40%) – in two boxes in Carrick-on-Suir his vote reached over 60%. In fact over half his vote came from these two towns alone.
Of the other candidates, GOLDSBORO (FF) polled well in the north-east of the constituency but was likely stymied by former party colleague Mattie McGrath’s continuing grip on Fianna Fáil voters elsewhere in the constituency. BROWNE (SF) was more competitive than I expected as his vote didn’t fall in line with Sinn Féin’s vote nationally – he polled 20% in both Cashel and Carrick-on-Suir. O’HENEY (IND) was very much a Local Man for Local People – over 90% of his vote came from the Cashel-Tipperary area and the vast majority of that vote was centered around Tipperary Town (where he took 39%) and surrounding rural areas.
WATERFORD
Waterford returned two Sinn Féin TDs (David Cullinane and Conor McGuinness), one Fianna Fáil TD (Mary Butler) and one Fine Gael TD (John Cummins).
Less than five hundred votes seperated Cllr Conor McGuinnesss (Sinn Féin) from outgoing Independent TD Matt Shanahan on the firstt counr, and given the latter’s supposed geographical advantage (being based in the city as opposed to McGuinness who was comparatively isolated in the wilds of West Waterford) he could have been forgiven if he had nurtured a cautious optimism during the long hours st the count centre.
However, the first count turned out to be the closest he ever got. By the sixth count, he was nearly fourteen hundred votes behind. However a glimmer of hope emerged when he took a very healthy skelp of the Aontu transfers to bring him back within 639 votes of McGuinness with Mary Roche’s (Social Democrats, formerly Independent/Fianna Fáil) 4,887 votes to be distributed.
He possibly still retained some hope as both he and Roche were Waterford City based – and indeed, he had replaced Roche when she stepped down (as an Independent) from the Council in 2018.However, it was not to be – Roche’s votes broke 35% to 27% for McGuinness giving him a winniing margin of just under a thousand votes.
The Map below shows the poll-toppers in selected polling stations (excluding the city).
Mary Butler topped the poll in her home town of Portlaw, but actually did best in Rural Areas of the south and West. Conor McGuinness polled well in Dungarvan and also rural areas to its south and west.
The Map below shows selected Polling Stations in Waterford City
David Cullinane dominated much of the west and south of the city, taking up to 60% of the vote. The vote was more nuanced in the east of the city, with Cummins taking a quarter of the vote in Ballygunner.
Finally, this map shows the poll-toppers in Dungarvan.
The reason I chose to have a look at Dungarvan is I noticed whilst looking through the tallies that there were clear differences between the five polling stations there – Scoil Mhuire on the east side (Abbeyside) of the river, the Fusion Centre on the south-west bank of the river, Saint Joseph’s and Saint Mary’s in the west of the town proper, and finally the village of Ballinroad about a mile to the east of the town which is now a de facto suburb thanks to the pull of the Celtic Tiger.
Mary Butler topped the poll with roughly a quarter of the vote in Ballinroad, Scoil Mhuire and the Fusion Centre while Conor McGuinness took about 40% in the west of the town.
Below is a table showing candidate performance in geographic areas of the constituency – the west includes Lismore and Dungarvan Electoral Areas (29% of the tallied vote), the centre is Portlaw-Kilmacthomas Electoral Area (17%) and Waterford City (54%)
CANDIDATE
WEST
CENTRE
CITY
Cullinane(SF)
6%
15%
34%
Cummins (FG)
20%
22%
18%
Butler (FF)
28%
25%
12%
McGuinness (SF)
26%
11%
2%
Shanahan (IND)
4%
10%
13%
TDS AND RUNNERS-UP
I also broke down the three city areas into the Urban areas of East, South and West as well as separating Tramore and the Rural areas.
CANDIDATE
EAST
WEST
SOUTH
TRAMORE/R.
Cullinane(SF)
21%
42%
51%
24%
Cummins (FG)
22%
15%
12%
21%
Butler (FF)
13%
11%
9%
14%
McGuinness (SF)
3%
3%
3%
3%
Shanahan (IND)
19%
9%
7%
15%
TDS AND RUNNERS-UP – CITY
CULLINANE (SF) polled well right across the Constituency, only dropping below 10% in the rural West of the constituency where his party colleague Conor McGuinness was based. In the city he took over half the vote in Ballybeg, Ballytruckle and Lisduggan.
CUMMINS (FG) was runner-up last time on a two man ticket, but in an impressive performance improved the Fine Gael vote against the national trend to gain a seat. His worst area ironically was his home area Waterford City South (13%) – though that probably has more to with demographics as WCS has the lowest proportion of middle-class households in the country. He took strong polls in the vicinity of the Comeragh Mountains – 37% in Coumaraglin, 36% in Rathgormack.
MARY BUTLER (FF) topped the poll in her hometown of Portlaw with a third of the vote but her best polls were in the rural West – 50% in Ballysaggart, 41% in Knockanore and Melleray. She didn’t have a running-mate in the city this time, so the Fianna Fáil vote in tbe city was down somewhat.
CONOR McGUINNESS (SF) took a creditable vote in Dungarvan (30%, rising to 40% in the west of the town). He also polled strongly along the coastline to the west – 43% in Ring, 31% in Ardmore. He took nearly 85% of the Sinn Féin vote in Dungarvan and about three quarters in Lismore, but less than half in Portlaw-Kilmacthomas which did leave him vulnerable to challenge.
Of the other candidates, Shanahan (IND) actually improved his vote from 2020, but as noted above geography did not come to his aid to allow him overtake McGuinness. It was somewhat ironic that the final nail in his electoral coffin were the transfers of Mary Roche (SD,ex-IND/FF) given that he replaced her on the council in 2019. He did best in the east of the city, though his strongest performance was in the village of Butlerstown (29%), a few miles west. Roche (SD) polled decently, her strongest poll being 8% each in Ballytruckle and Ballygunner in the south of the city. O’Cathasaigh (GP) was unexpectedly thrown into tbe Dáil in 2020; in 2024 he was unceremoniously thrown out. His vote didn’t top 5% anywhere in the city.
KERRY
The constituency of Kerry remained the same in the redraw, comprising the whole county of Kerry.
Kerry was an early stronghold for Fianna Fáil, with the party taking five out of seven seats in both the 1932 and 1933 elections – on the second occasion with 67% of the vote – and five out of the seven seats in the new Kerry North and South in 1937 and 1938. However from 1943 the vote fragmented somewhat, with Dan Spring’s Kerry North victory for Labour in 1943 heralding a 59 year unbroken run for Labour (though son Dick only survived by fourt votes in 1987), and both Clann Na Talmhan and Clann na Poblachta winning seats in Kerry North in 1954.
This time, Fianna Fáil won two seats (Norma Foley TD and Cllr Michael Cahill), the Healy-Raes two seats (Michael and Danny), and Sinn Féin one seat (Pa Daly TD). For the first since 1948 Fine Gael has no TD in Kerry.
On the first count, Michael Healy-Rae took nearly one and a half quotas (18,596 votes) – an increase on his 2020 votes. Only 47% of his 5,513 vote surplus went back to his brother Danny – clearly not all MHR voters bought into the concept of a Healy-Rae brand. The equivalent transfer rates in 2016 and 2020 were 53½% and 50% respectively.
There were effectively six candidates for the five seats – the sixth candidate Billy O’Shea (FG) started on 7,932 votes, 5,908 votes ahead of the next candidate Linda Gordon-Kelleher (FF). There were a further ten candidates under her. Altogether, the six competitive candidates took over 80% of the vote.
O’Shea started off 334 votes behind Michael Cahill (FF) – that was close as he got. The elimination of Lin da Gordon Kelleher (FF) on the tenth count stretched tbe margin to 1,083 which was reduced to 757 votes on the final count.
The following table details selected party transfers throughout the count.
PTY
CNT
FF
FG
SF
H-R
OTH
NT
VOTES
IFP
4th
10%
2%
11%
11%
59%
6%
816
PBP
5th
4%
2%
46%
3%
42%
3%
1,089
II
6th
34%
7%
12%
18%
22%
6%
1,181
LAB
11th
24%
16%
11%
33%
15%
2,438
AON
12th
22%
8%
9%
61%
2,897
GP
13th
40%
23%
37%
3,439
SELECTED TRANSFERS
Note the “anti-establishmenr” transfer patterns of some of the smaller parties – over half of the Irish Freedom Party transfers went to parties other than the big three or the Healy-Raes. Later – with most smaller parties eliminated – more than half of Aontu transfers were non-transferable.
A third of Independent Ireland transfers went to Fianna Fáil – II candidate Tom McEllistrim was of course a former Fianna Fáil TD. It’s also notable that Fianna Fáil did better than Fine Gael in all the counts listed above, even those from Labour and Fine Gael.
For the purposes of this analysis I’ve split the Constituency into ftwo parts : the three northern LEAs (Listowel, Tralee and Castleisland) and the three southern LEAs (Killarney, Dingle, Kenmare).
CANDIDATE
NORTH
SOUTH
M Healy-Rae (IND)
24%
23%
D Healy-Rae (IND)
8%
15%
Daly (SF)
20%
9%
Foley (FF)
20%
5%
Cahill (FF)
3%
19%
O’Shea (FG)
10%
10%
FF Total
24%
29%
SF Total
21%
11%
TDS AND RUNNERS-UP
MICHAEL HEALY-RAE (IND) – The fact that Michael Healy Rae (IND) took nearly a quarter of the vote in both North and South Kerry is testament to his immense appeal to Kerry voters across the county. He topped the poll (44%) in the hamlet of Tuosist deep in the Beara peninsula – he also topped in the village of Ballylongford (31%) on the banks of the Shannon estuary. According to Google Maps, Ballylongford and Ballylongford are eighty miles apart by road and expected travel time between them is two hours and one minute. One can’t help presume that there are markedly different dialects of Kerryonian spoken in the two localities which if nothing else are testament to MHR’s linguistic skills.
Despite polling nearly a quarter of the vote across the constituency, he only took over half the vote in three boxes, Knockanure (50%) in Listowel, and Lauragh (65%) and Tahilla (63%) in Kenmare.
He topped the poll across the Dingle peninsula, the west and south of the Iveragh peninsula and the kerry portion of the Beara peninsula.
In Listowel he took one third of the vote – all the more remarkable given that the Healy-Raes don’t have a Councillor in the area.
PA DALY (SF) saw his vote fall by a quarter since 2020 and had to wait until the 7th count to be elected this time – this can be partially explained by the presence of a running mate who took 1½% of the vote. He topped the poll in Tralee with 29% of the vote, reaching 40% in some parts of the town.
DANNY HEALY-RAE (IND) saw his vote tightly corralled into Killarney Electoral Area and part of Castleisland Electoral Area under the terms of the Healy-Rae Electoral strategy. He took just over two-thirds of the Healy-Rae vote in the former Area and about three-fifths in the latter. He also took about one-sixth in the Kenmare area, mainly due to the presence of Kilgarvan where Danny took 41% of the vote and Michael 31%. His biggest polls were along the Cork border at Gneevenagullia (61%), Meentogues (53%) and Rathmore (50%).
NORMA FOLEY (FF) polled strongly in Tralee (where she took 27% , just behind Pa Daly, and was ahead in teo of the five main polling stations in the town) and its hi nterland. Overall she topped the poll in Tralee Electoral Area taking a quarter of the vote and also one fifth of the vote in Listowel Electoral Area. She polled strongest in rural areas adjacent to Tralee Town – Spa, Blennerville and Listellick, all around 35%
MICHAEL CAHILL (FF) polled strongly in the greater Killorglin area and along the Northern shore of the Iveragh peninsula. He polled strongest in Glenbeigh (71%) and Cromane (54%).
The only other candidates to poll competitively was Billy O’Shea (FG). His downfall was his failure to achieve any meaningful local advantage in his local area of Kenmare – he only got 11%. Even in his hometown of Killorglin he was out-polled by Michael Cahill by 40% to 17%. He actually polled better in the Listowel area, and took over 20% in Coolard and Tarbert, but in each case behind Michael Healy-Rae.
Cork South-West
Between 1981 and 2002, the three seat Cork South-West constituency was consistenly Fine Gael’s gilt-edged constituency, returning P.J.Sheehan and Jim O’Keeffe in every election. They repeated the feat in 2011. Yet in both 2020 and 2024 they failed to return a single seat.
Three TDs were returned – Michael Collins (Indpendent Ireland), Holly Cains (Social Democrats) and Christopher O’Sullivan (Fianna Fáil).
Fine Gael actually outpolled Fianna Fáil (11,125 to 9,115 votes) but were unable to hold that advantage as their internal transfer rate was insufficient.
Selected transfers are shown in the table below.
PTY
CNT
FF
FG
II
SD
OTH
NT
VOTES
GP
3rd
8%
17%
3%
46%
25%
1%
352
PBP
4th
3%
1%
4%
49%
39%
4%
369
LAB
5th
9%
16%
8%
48%
13%
6%
533
AON
6th
7%
12%
51%
6%
16%
8%
821
SF
8th
4%
4%
27%
44%
8%
13%
2,152
SELECTED TRANSFERS
The first three transfers all came from candidates on the left of the spectrum – all three saw transfers of nearly half the votes to the Social Denocrats. Note however that the Greens and Labour were much more likely to transfer to the “Establishment” parties (25%) than People Before Profit (4%).
Also note the diifference between these vote patterns and that of Aontu’s – in the former category 48% of the vote went to the Social Democrats and only 6% to Independent Ireland, but Aontu’s transfer went 6% to 51%, a near perfect reversal. It’s also interesting to note that while 44% of Sinn Féin’s transfers went to the SDs, over a quarter went to Independent Ireland.
On the first count, Holly Cairns (SD) was 306 votes ahead of Christopher O’Sullivan (FF) who in turn was 2,993 votes ahead of Noel O’Donovan (FG). By the 10th count (when Cairns was elected) she had stretched her lead over O’Sullivan to 1,827 votes who in turn had increased his lead over O’Donovan to 3,602 votes.
On the final count, O’Donovan received 3,323 votes from his running mate Tim Lombard, a transfer rate of 56.8%. 1,824 votes went to O’Sullivan – over 30% – leaving O’Donovan some 2,103 votes adrift. The minimum transfer O’Donovan would have required to be elected (assuming no change in the numbers of non-transferable votes) therefore would have been 4,375 – just under three quarters of the vote.
To put that in context, recent transfer rates for Fine Gael in the constituency are as follows : 58.6% (2020) and 64.2% (2011). It was a high bar.
CANDIDATE
WEST
CENTRAL
EAST
Collins (II)
34%
22%
17%
Cairns (SD)
22%
19%
19%
O’Sullivan (FF)
16%
22%
17%
O’Donovan (FG)
13%
23%
5%
Lombard (FG)
4%
3%
19%
TDS AND RUNNERS-UP
COLLINS (IND) polled strongly across the Constituency except perhaps its easternmost tip. He topped the poll in three of the four largest towns (Bandon 31%, Skibbereen 31%, Bantry 37%). He topped the poll in Goleen (39%) on the Mizen Peninsula in far west and in the commuter village of Riverstick (29%) on the outskirts of Cork City – over sixty miles apart by road. His vote was down slightly from 2020. His highest polls were in Cahermore (45%) and Schull (42%).
CAIRNS (SD) more than doubled her vote from 2020 in a very strong performance. She topped the poll in Kinsale (26%) and like Collins topped the poll from the west to the east of the constituency.
O’SULLIVAN (FF) topped the poll in the town of Clonakilty (29%). He polled strongly in the centre of the constituency, taking 32% in Courtmacsherry and 34% in Drinagh and Derryclogh.
Of the other candidates, O’Donovan (FG) went toe-to-toe with O’Sullivan in the centre of the constituency and actually outpolled him in the Clonakilty-Skibbereen area by a handful of votes but failed to run up the big totals necessary. His best poll was 39% in Rosscarbery. Lombard (FG) was similarly unable to dominate the Eastern part of the constituency with decent polls from O’Sullivan, Cairns and Collins. His best poll was in the easternmost polling station in the constituency, Minane Bridge (41%).
CORK NORTH-WEST
Cork North-West holds the unusual distinction of being the only constituency in the country to have returned only Fianna Fáil and Fine Gael TDs since its foundation in 1981. It is also – with the departure of Ballincollig – almost certainly the most rural constituency in the country and contains parts of no less than eight separate Electoral Areas.
The main Electoral Areas however are Kanturk to the North and Macroom to the south – which in turn are nearly completely seperated by the Boggeragh mountains.
Mountain ranges tend to be very influential in determining geographic patterns of voting, and so it is here, with both Fianna Fáil and Fine Gael having one candidate on either sides of the mountains.
Cork North-West returned two Fianna Fáil TDs (Aindriais Moynihan and Michael Moynihan) and one Fine Gael TD (John Paul O’Shea). Michael Creed of Fine Gael (a cousin of the outgoing TD) was runner-up.
PTY
CNT
FF
FG
SF
OTH
NT
VOTES
PBP
3rd
7%
7%
43%
36%
6%
876
AON
5th
23%
26%
29%
22%
4,054
SF
6th
24%
21%
55%
7,530
SELECTED TRANSFERS
The first count saw Michael Creed (FG) start 382 votes behind his running mate John Paul O’Shea and 457 behind Michael Moynihan (FF). The successive counts made no substantive difference although on the 4th count the difference between Moynihan and Creed had narrowed to only 151 votes – on the final count that had risen to 365.
The transfers from the smaller parties brought Nicole Ryan (SF) from 1,869 votes behind Michael Creed to only 490 on the 5th count.
Interestingly, the Aontu transfer split between all three main parties, the largest portion going to Sinn Féin (29%) and the smallest to Fianna Fáil (23%) – which is somewhat ironic as the two Moynihans were on the Pro-Life side of the Abortion Debate in 2018, and that issue was of course foundational for Aontu.
Also interesting is that transferable Sinn Féin votes – less than half – split virtually equally between Fianna Fáil and Fine Gael.
And of further interest is the fact that although more votes were cast in the south of the constituency than the north, two of the three TDs elected were from the North. Part of the reason is that Michael Moynihan and John Paul O’Shea took just over two thousand votes in the southern Electoral areas, while Aindriais Moynihan and Michael Creed took just under a thousand votes from the North.
CANDIDATE
NORTH
SOUTH
Moynihan A (FG)
3%
32%
Moynihan M (FF)
35%
4%
O’Shea (FG)
33%
5%
Creed (FG)
3%
29%
FFTotal
38%
36%
FGTotal
36%
34%
TDS AND RUNNERS-UP
AINDRIAIS MOYNIHAN (FF) polled strongly and consistently across the south of the constituency, though he didn’t poll above 50% in any single polling station. He also managed to top the poll in Millstreet (24%) which is in the Macroom Electoral area although it’s north of the Boggerah Mountains. His best poll was 44% in the village of Newcestown south of Macroom.
O’SHEA (FG) polled strongly in the north-east of the constituency, especially in the rural hinterland of Mallow. He took 31% in the town of Charleville. His best polls were Glantane (65%) and Dromahane (55%) between Kanturk and Mallow.
MICHAEL MOYNIHAN (FF) polled strongly across the rural north of the Constituency, particularly nearing the Kerry border. He polled 45% in the town of Kanturk, 73% in Kiskeam, 59% in Foilogohig and 55% in Boherbue.
Of the other candidates, Creed (FG) fell just short despite taking 35% in the constituency’s biggest town Macroom. His vote was strongest to the North and west of that town reaching 56% in Clondrohid. Ryan (SF) polled 13% which a decent performance considering Sinn Féin didn’t even contest in 2020 and performed poorly in the local elections – her best poll was in Bweeng (25%). Kealy (AON) caused a stir when she took nearly four thousand votes in 2020 and came within a hundred votes of taking a seat in Kanturk in the local elections. However, her momentum stalled somewhat with 8½% of the vote.
LONGFORD-WESTMEATH
Longford-Westmeath returned 2 Fine Gael TDs (Michael Carrigy and Peter Burke), 1 Fianna Fáil TD (Robert Troy) , 1 Sinn Féin TD (Sorca Clarke TD) and 1 Independent TD (Kevin Moran).
Longford-Westmeath became a five seater for the first time, but only returned one Longford TD as compared to four for Westmeath. By contrast in 2007, two of the four elected TDs were from Longford.
There were no surprises in Longford-Westmeath. In Westmeath the top four candidates were all more than four thousand votes ahead of their nearest challenger (Paul Hogan of Independent Ireland), while in Longford Michael Carrigy of Fine Gael led incumbent Joe Flaherty (Fianna Fáil) by nearly two thousand votes.
For the purposes of this analysis I’ve split the Constituency into five parts : the whole county of Longfo rd, and the four electoral areas of Westmeath : Athlone, Moate, Mullingar and Kinnegad. Each of the five candidates elected did best in a single one of those areas.
Below is a map of the poll-toppers in the largest Urban areas.
Much of the Kinnegad area had been in Meath West in 2020 – in other words parts of East Westmeath returned westwards from Meath West into Longford-Westmeath. Try saying that at speed after a few pints of Arthur’s finest.
CANDIDATE
L’FORD
A’LONE
MOATE
M’GAR
K’GAD
Burke (FG)
2%
5%
24%
40%
28%
Troy (FF)
2%
4%
28%
19%
22%
Moran (IND)
4%
54%
13%
1%
2%
Carrigy (FG)
34%
1%
1%
0%
1%
Clarke (SF)
7%
7%
10%
17%
20%
Flaherty (FF)
25%
1%
1%
0%
1%
TDS AND RUNNERS-UP
BURKE (FG) took a very impressive 37% out of Mullingar town. He took 47% in the Gaelscoil in the south of the town and 44% in the Presentation Convent in the east. He took over half the vote in Ballinea, Curraghmore and Walshestown.
TROY (FF) took 60% in his home village of Ballinacarrigy. He polled well through the centre of the county, also taking over a third of the vote in Ballymore, Rathowen and Tyrrellspass.
MORAN (IND) polled over 50% in the town of Athlone, polling best in its Eastern areas and nearby communities such as Coosan (68%), rural Cornamaddy (73%) and Glasson (58%). He also polled well in neighbouring areas of the Moate Electoral Area (Moate 24%, Mount Temple 37%) and also areas along the South Longford border (Ballymahon 19%, Kenagh 10%)
CARRIGY (FG) took one third of the vote in Longford. He was narrowly outpolled by FLAHERTY (FF) in the southern Ballymahon Electoral Area (26% to 29%) and in Longford Town (28% to 28%) but compensated by beating him 49% to 17% in the northern Granard Electoral Area. He took over half the vote in Aughnacliffe and Ballinalee.
MEATH WEST
Meath West returned 1 Fianna Fáil TD (Aisling Dempsey), 1 Sinn Féin TD (Johnny Guirke) and 1 Aontu TD (Peadar Toibin).
Dempsey was just over seven hundred votes ahead of Linda Murray Nelson of Fine Gael on the final count.
The Constituency consists of the whole of the Navan and Trim Electoral Areas, the southern part of the Kells Electoral Area and a small portion of the Ratoath Electoral Area.
CANDIDATE
KELLS
NAVAN
TRIM
Guirke (SF)
35%
23%
16%
Toibin (AON)
16%
30%
13%
Dempsey (FF)
21%
13%
21%
Nelson (FG)
16%
18%
15%
TDS AND RUNNERS-UP
The part of the Kells area in the North is largely rural and contains the small towns of of Athboy and Oldcastle. The Navan area is dominated by the town where over 80% of the voters live. The Trim area (with the bir of Ratoath) lies to the south – Trim and Navan contain roughly 40% of the votes each and Kells just under 20%.
Below is a map of the poll-toppers in the larger towns and villages in the Constituency.
Selected Results
GUIRKE (SF) polled very strongly in his base of Oldcastle (59%) in the far north-west of the constituency as well as surrounding rural areas Ballinlough (61%) and Ballinacree (44%). In Navan, he took a quarter of the vote rising to 32% in Scoil Mhuire in the centre of the town. His vote was lighter in the south of the constituency although he did take 30% in Castlejordan.
TOIBIN (AON) maintained and slightly improved upon his strong 2020 vote in Navan Town taking 30% there, rising to 35% in the north-west of the town.
DEMPSEY (FF) polled moderately in Navan but compensated by pulling a surprisingly decent vote from the North of the Constituency. She took 50% in Batterstown and 30% in Baconstown in the Trim area, but also 24% in Athboy in the Kells area.
NELSON (FG) outpolled Dempsey by over seven hundred votes in Navan, but this was cancelled out by her failure to match Dempsey in the Kells and Trim areas. In Navan she polled best in the Johnstown boxes (20%).
Of the remaining candidates, NOEL FRENCH (IND) took 22% in the Trim Local Electoral Area, but it wasn’t enough to put him in the frame. His vote peaked at 37% in Longwood. RONAN MOORE (SD) took 9% in the Trim Area and 6% in Navan.
WICKLOW
Wicklow dropped a seat this time to four with the southernmost part of the constituency going into the new Wicklow-Wexford constituency.
It returned two Fine Gael TDs (Simon Harris and Edward Timmons), one Sinn Fein TD (John Brady) and one Social Democrat TD (Jennifer Whitmore).
Bray East, Bray West, Greystones and Wicklow Electoral Area all lie within the boundaries of the new Wicklow constituency. In addition the majority of the land and population of the Baltinglass Electoral Area lie within the Constituency, as well a tiny bit of Arklow.
One TD was elected from the Bray Areas (Brady), two from Greystones (Harris and Whitmore) and one from Baltinglass (Timmons) – Roughly 30% of the votes were cast in Bray, 27% in Greystones, 26% in Wicklow and 17% in Baltinglass.
CANDIDATE
BRAY
G’STONES
W’LOW
B’GLASS
Harris (FG)
31%
46%
24%
15%
Brady (SF)
19%
10%
16%
13%
Whitmore (SD)
12%
20%
21%
8%
Timmons (FG)
1%
1%
3%
24%
Donnelly (FF)
5%
6%
6%
8%
TDS AND RUNNERS-UP
Edward Timmins (FG) was the first candidate to win a seat from West of the mountains since his brother Billy in 2011. He started off 503 votes behind Stephen Donnelly, but his receipt of 46% of Simon Harris’ surplus but him 941 votes ahead. By the 12th count, he had extended the leaf to nearly fourteen hundred votes and Shay Cullen’s elimination left the difference at 1.563 v otes.
As can be seen, the large urban centres on the East Coast are largely indistinguishable. More detailed maps are available below.
The part of Baltinglass in the Wicklow constituency is shown above. Most of the population is stretched along a thin strip of land running between the mountains and the Wicklow Border.
WICKLOW ELECTORAL AREA
BRAY AND GREYSTONES ELECTORAL AREA
HARRIS (FG) swept all before him, taking a quota and a half on the first count; his vote reached 54% in Delgany (officially a village but now largely a part of the Greystones urban sprawl). He also took over a third of the vote in South and East Bray. Further south, he topped the poll in Wicklow Town (25%) and Kilcoole (35%). Interestingly, he outpolled his running-mate Eddie Timmins in the northernmost parts of the Baltinglass Electoral Area. In Bray Town he polled a fairly constant 35% to 40% across the east of the town – in the west of the town it was a virtual three way tie between himself, BRADY and Independent Joe BEHAN. He also took big polls in Enniskerry (45%) and Curtlestown (49%)
BRADY (SF) topped the poll in Bray north of the River Dargle (40%) and in Rathnew (25%). He took 55% in one box in North Bray and 44% in one in south-east Bray.
WHITMORE (SD) polled best in Greystones (21%) and Delgany (20%) – all the more impressive given Harris’ strength in the area.
TIMMINS (FG) polled best in the more rural southern part of the Baltinglass area – Grangecon (49%), Baltinglass (43%), Kiltegan (37%) but fared less well with voters further north – he only took 9% in Blessington.
Of the other candidates, Donnelly (FF) polled poorly across the constituency – his best poll was 13% in Donaghmore near Baltinglass. Cullen (FG) polled very well in the rural western part of Wicklow Electoral Area – 44% in Glendalough and 43% in Roundwood.
KILDARE NORTH
Kildare North became a five seater this time with the addition of the villages of Caragh and Twomilehouse from Kildare South.
Kildare North returned two Fianna Fàil TDs (James Lawless TD and Cllr Naoise O’Cearuil), one Fine Gael TD (Cllr Joe Neville), one Sinn Féin TD (Reada Cronin TD) and one Social Democrat TD (Aidan Farrelly)
The Constituency consists of all or part of six Electoral Areas – Celbridge; Leixlip and Maynooth in the North along the M4 corridor; Naas and a small part of Newbridge along the M7 corridor and roughly half of Clane in the West.
I’m going to look at the Tally Results using four blocks – Naas (the Electoral Area plus Caragh and Twomilehouse), the North-East (Leixlip and Celbridge Electoral Areas), Maynooth (the Electoral Area), and Clane (the parts of the Electoral Area in Kildare North).
CANDIDATE
NTH-EAST
MAYNOOTH
CLANE
NAAS
LAWLESS (FF)
8%
8%
19%
26%
FARRELLY (SD)
17%
12%
8%
20%
CRONIN (SF)
13%
10%
11%
13%
NEVILLE (FG)
21%
6%
2%
5%
O’CEARUIL (FF)
12%
21%
3%
7%
DURKAN (FG)
7%
11%
6%
13%
TDS AND RUNNERS-UP
Interestingly, despite being the second largest town in North Kildare, there was no major candidate from Celbridge. This was particularly fortuitous news for Leixlip-based Joe Neville who otherwise would have been strategically hemmed in to a small pocket of North-East Kildare. The main Celbridge votes broke as follows : Farrelly (SD) 16%, O’Cearuil (FF) 14%, Cronin (SF) 14%, Neville (FG) 11%, Lawless (FF) 10%, Durkan (FG) 8%, Feeney (LAB) 6%.
POLL-TOPPERS IN SELECTED BOXES
Kildare North is predominantly urban – over 80% of the votes was cast in towns – but there are rural areas in Naas, Clane and Maynooth EAs. Lawless (FF) polled better in rural areas (20% versus 14%), though his running-mate O’Cearuil was slightly stronger in urban areas (11% versus 8%). Leixlip-based Neville (FG) did better in Urban areas (10% versus 6%), as did Cronin (SF) who took 12% in Urban areas and 10% in rural. Farrelly took 13% in both Urban and Rural areas, reflecting his dual bases (I’ll explain later….)
The count was relatively uneventful, with the top five candidates on the first count eventually being elected. However, there was a noteworthy quirk on the elimination of Naas-based Cllr Evie Sammon (FG) on the 7th count. It would have been expected – given that Bernard Durkan had been working Naas for forty years, and that Leixlip-based Joe Neville would have been practically unknown in the town – that the lion’s share of Sammon’s party transfers would gravitate towards Durkan once she was eliminated – but the opposite happened. Of her 3,410 votes, on the 8th count 1,314 (38½%) went to Neville and only 637 (19%) went to Durkan.
The reason? Apparently, Neville and Sammon had a pact whereby their posters in their respective bases urged #2 transfers to be directed to one another ahead of Durkan. In truth though, even in the absence of this pact the overall result was unlikely to have been much different – Durkan was 1,760 votes behind Neville on the final count and 1,563 behind O’Cearuil. The margins were simply too large. That said, I’m sure Fine Gael constituency meetings have been fairly lively since.
LAWLESS (FF) topped the poll in every polling station in the Naas area bar Twomilehouse (where Sammon took 26%). In Naas he did better in the north of the town (27%), than tne south (20%). Interestingly, he polled better in Caragh (33%) than his home town of Sallins (31%). He also topped the poll in Johnstownbridge (24%) and Newtown (21%) in the rural North-West.
POLLING STATIONS IN THE NAAS AREA
FARRELLY (SD) took nearly a third of the vote in his home village of Prosperous, and a quarter of the vote in the neighbouring town of Clane. However he also topped the poll in Celbridge (16%), and came a very creditable second in Leixlip (17%) – this suggests that Catherine Murphy managed to persuade a decent swathe of her voters in the area to keep the party faith in her absence.
SELECTED POLLING STATIONS IN THE WEST
CRONIN (SF) saw her vote fall but rumours of her demise proved to be unfounded. She topped the poll (15%) in a hotly Contested Kilcock ahead of O’Cearuil (15%), Farrelly (13%), Lawless (12%) and Durkan (11%). In her home town of Maynooth, she took 8% behind O’Cearuil (28%), Feeney (18%), Farrelly (13%) and Durkan (8%).
NEVILLE (FG) took just under half his vote in his hometown of Leixlip, and much of the rest of his vote in neighbouring Celbridge and Maynooth. In Leixlip itself, he polled much better (37%) in the newer and more middle-class South and west of the town than in the older North (26%).
POLLING STATIONS IN THE NORTH-EAST
O’CEARUIL (FF) took an impressive 28% in his hometown of Maynooth, not least because the town had been a bit of a blackspot for Fianna Fáil support for many years. He also took a creditable 14% in Celbridge and topped the poll in Straffan (19%).
Of the other candidates, Durkan (FG) probably just took one Election too many after nearly 43 years in the Dail (since 1981, but with a minor interlude in 1982). He topped the poll in the rural areas of Rathcoffey (22%) and Broadford (23%) on the very western extremity of the constituency. Feeney (LAB) took a creditable 18% in Maynooth but the current minor party status of Labour meant that there wasn’t a sufficient constituency wide vote to raise her into contention. Sammon (FG) didn’t actually vote for herself – she lives just across the Constituency border in Ballymore. She polled decently in Naas (14%) but it wasn’t enough. She did however top the poll in Twomilehouse (26%). Clear (IND, ex-SD) also took about 14% in Naas, but little outside it. He did however make it to the second last count.
KILDARE SOUTH
Kildare South remained a four-seater with the loss of Portarlington and Ballybrittas in Laois and Offaly, and also Caragh and Twomilehouse to Kildare North.
Kildare North returned 1 Fine Gael TD (Martin Heydon), 1 Sinn Féin TD (Siona Ni Raghallaigh) and 1 Labour TD (Mark Wall). Fiona O’Loughlin (Fianna Fáil) was the runner-up.
Kildare South consists of all of the Kildare and Athy Electoral Areas, most of the Newbridge EA and roughly half of Clane as well as Ballymore in Naas. I’m going to group Clane and Kildare together for the purposes of the below analysis under the heading “North-West”.
Fiona O’Loughlin started the count in second place, 248 votes ahead of Shonaigh Ni Raghallaigh (SF) and 835 votes ahead of Mark Wall (LAB).
The table below details the main transfers.
PTY
CNT
FF
FG
LAB
SF
OTH
NT
VOTES
SOL
3
2%
3%
8%
28%
59%
1%
505
GP
5
13%
17%
22%
6%
39%
3%
618
IFP
8
2%
2%
7%
11%
53%
25%
1,362
AON
9
7%
8%
7%
20%
33%
20%
2,380
SD
10
10%
10%
32%
27%
12%
9%
3,888
FG
12
57%
32%
11%
630
SELECTED TRANSFERS
Shonaigh Ni Raghallaigh (SF) passed O’Loughlin on the 7th count on the votes from Ballitore-based Independent William Carton. She particularly benefitted from transfers from Solidarity and the Social Democrats.
Mark Wall overtook O’Loughlin on the 10th count with a 39% transfer from the Social Democrats. This was somewhat surprising as the Social Democrats candidate Chris Pender’s vote was heavily based in Newbridge, whereas Mark Wall’s vote was very geographically concentrated way down south in Athy and surrounding areas – Wall’s previous electoral forays had come undone due to his relative geographical isolation impacting upon his transfers. However, this time that trend was negated. He also did markedly better this time from centre-left transfers than he did in 2020 – in the former year he took 644 votes from tbe Greens and the Social Democrats (18% of the total)), in 2024 that doubled to 1,376 votes (31%).
CANDIDATE
ATHY
NEWBRIDGE
NTH-WEST
HEYDON (FG)
21%
18%
20%
NI RAGHALLAIGH (SF)
12%
17%
20%
WALL (LAB)
38%
5%
8%
O’LOUGHLIN (FF)
10%
18%
21%
TDS AND RUNNERS-UP
HEYDON (FG) had his base in the villages and farming areas in the foothills of the Wicklow mountains that lie along the Eastern border of the constituency. He took half the vote in Halverstown, 46% in Brannockstown (a most unusual Irish village in that it has neither a pub nor a Catholic Church), 43% in Crookstown and 42% in Bigstone.
WALL (LAB) has an extraordinarily strong base in Athy and surrounding areas, building upon a strong history of Labour support in the town. Labour support elsewhere in the constituency melted like snow in the Great Labour purge of 2016, but remained solid in Athy. He took a massive 62% in the town, 66% in Churchtown, 56% in Kilberry and 42% in Kilmeade.
NI RAGHALLAIGH (SF) is the only Sinn Féin Councillor in June and only took her seat after a recount last June. She was long odds to take a seat this time but upset the bookies on the day. She polled well in her Kildare town base (22%) as well the Bog of Allen areas further north where Sinn Féin have been strong since the Turf Cutting disputes in 2014 – she took 33% in Killinagh (historically a very strong Fianna Fáil box), 27% in Derrinturn and 28% in Kilmeague.
Of the other candidates, Fiona O’Loughlin (FF) has to be considered extremely unlucky as she was also narrowly beaten in 2020. It is ironic that she topped the poll in the constituency’s largest town Newbridge (20%) but still failed to be elected. She also polled well in her home town of Rathangan (39%) and Clongorey (31%) but her poor performance in more southern rural areas may have been her undoing. Chris Pender (SD) didn’t top the poll anywhere but took a creditable 15% in Newbridge, reaching 20% in parts of the North of the town. Outgoing TD Cathal Berry (IND) lost a third of his vote in the redraw due to the loss of Portarlington, but even if the fates had not dealt that cruel card, his vote take would have fallen short. He topped the postal ballot; taking roughly a third of votes.
DUBLIN CENTRAL
DUBLIN CENTRAL
Dublin Centra l returned 1 Fine Gael TD (Paschal Donohue), 1 Social Democrat (Gary Gannon) , 1 Labour (Marie Sherlock) and 1 Sinn Féin TD (Mary Lou McDonald).
Marie Sherlock narrowly beat Gerry Hutch for the final seat.
The Constituency consists of two Electoral Areas – Cabra-Glasnevin and North Inner City. Roughly 60% of the votes were cast in the Cabra-Glasnevin area.
CANDIDATE
CABRA-GLAS.
N.I. CITY
McDonald (SF)
20%
19%
Donohue (FG)
20%
12%
Gannon (SD)
13%
13%
Sherlock (LAB)
9%
5%
Hutch (IND)
5%
16%
TDS AND RUNNERS-UP
The North Inner City is predominantly working-class, while Cabra-Glasnevin area is more mixed with a sizeable middle-class population in the north and east of the area (Glasnevin, Drumcondra, Phibsboro) and more heavily working-class areas in the west around Cabra.
Below are the poll-toppers in selected polling stations across the Constituency.
McDONALD (SF) polled fairly evenly across the North Inner City (15%-25); her running mate Janice Boylan polled around 6%. She polled best in West Cabra (45%), but only about 10% in Dumcondra, Glasnevin and Phibsboro.
DONOHUE (FG) polled better in the Cabra-Glasnevin area than he did in the North Inner City, though he did poll around 15% along the North Circular Road and in Stonybatter. In Cabra-Glasnevin, he polled 30% in Glasnevin, 25% in Drumcondra, and about 20% in Phibsboro. He polled 10% in West Cabra and only 5% in Sean McDermott Street.
GANNON (SD) polled more evenly across the Constituency, though like Donohue he polled best in Drumcondra (18%) and worst in Cabra West and Sean McDermot Street (5% and 6%).
SHERLOCK (LAB) polled a steady 10% across Glasnevin, Drumcondra and Stoneybatter peaking at 17% in Phibsboro. She only took 1% in Sean McDermott Street.
HUTCH (IND) took over two-thirds of his vote of his vote from the North Inner City, peaking at 44% in Sean McDermot Street and 36% on the North Wall. He also took over one fifth of the vote in Marlborough Street and Gardiner Street. By contrast he was received rather more coolly in Drumcondra and Phibsboro (2%) and Glasnevin (1%). His highest poll outside the Inner City was in Cabra West (10%).
Of the other candidates, outgoing TD Neasa Hourigan (GP) peaked at 11% in Phibsboro, Mary FitzPatrick (FF) polled 10-15% in Glasnevin and Drumcondra but only about 4% in the Inner City and Malachy Steenson polled over 10% in the North and East Walls, the North Strand and Sean McDermott Street but was clearly stymied by the pulling power of Gerry Hutch in that area.
DUBLIN BAY NORTH
Dublin Bay North returned 1 Fianna Fáil TD (Tom Brabazon), 1 Fine Gael TD (Naoise O’Muiri), 1 Sinn Fein TD (Denise Mitchell), 1 Social Democrat (Cian O’Callaghan) and 1 Independent (Barry Heneghan).
For the purposes of this analysis I’ve split the Constituency into four parts : the electoral areas of Clontarf, Howth-Malahide, Donaghmede and Artane-Whitehall.
Clontarf and the part of Howth-Malahide in DBN lie along the coast and have a predominantly middle-class population. Donagmede and particularly the part of Artane-Whitehall within DBN are more working-class.
Below are the Poll-Toppers in selected Polling Stations in Dublin Bay North.
Barry Heneghan started off in 8th place on 3,602 votes (less than one third of a quota) and in the firseight counts only picked up about eight hundred votes – although he did overtake Micheal O’Donnacha of Sinn Féin on the 8th count. However, with the election of Cian O’Callaghan, he quickly became the favoured recipient of left-leaning/Independent transfers.
* 9th count – 785 (29%) of Michael Burke’s votes.
* 10th count – 904 (25%) of Aontu votes.
* 11th count – 909 (23%) of Labour votes.
* 12th count – 1,728 (32%) of Sinn Féin votes.
The Aontu votes took him into 5th place ahead of Tormey (FG) and Heney (FF) and he maintained that lead.
CANDIDATE
A-W’HALL
C’TARF
D’MEDE
H-M’HIDE
O”Callaghan (SD)
8%
14%
11%
29%
Mitchell (SF)
32%
9%
15%
6%
Brabazon (FF)
8%
5%
20%
9%
O’Muiri (FG)
4%
16%
5%
6%
Heneghan (IND)
3%
10%
3%
3%
Heney (FF)
4%
15%
4%
6%
FF Toral
13%
20%
24%
15%
FG Total
7%
23%
11%
26%
SF Total
36%
11%
27%
11%
TDS AND RUNNERS-UP
O’CALLAGHAN (SD) polled very impressively in the Fingal part of the constituency taking big polls in Howth (34%), Baldoyle (30%), Sutton (28%) and Bayside (23%). He polled decently throughout the Constituency, only dipping below 10% in the Artane-Whitehall area. Notably he took over 20% in the Fairview/Marino area.
MITCHELL (SF) saw her strongest vote in the Artane-Whitehall area where it reached over 40% in Darndale and Priorswood – in 2020 she polled over 70% in those boxes. She got a decent vote as far south as Donnycarney and east to Raheny.
BRABAZON (FF) took a big personal vote out of the Donagmede area which saw Fianna Fáil double its vote there. He took over one fifth of the vote in Ayrfield, Edenmore and Grange. He also polled decently in parts of Coolock.
O’MUIRI (FG) inherited Bruton’s vote in the south of the constituency and topped the poll in the Clontarf area. He took 25% in Belgrove.
HENEGHAN (IND) was elected more due to his transfers than his first preferences and only took over 10% of the vote in three polling stations – two in Clontarf, one in Killester.
HENEY (FF) polled well in the Clontarf Area (17% in Killester, 18% in East Drumcondra) but it wasn’t enough to put her in contention.
Of the other candidates, MacDonnacha of Sinn Féin polled best in the Donaghmede area. Folan (LAB) failed to hold onto O’Riordain’s Labour seat – he polled 9% in Raheny and 7% in Killester. Four candidates (Burke, FitzSimons, Garrigan, Coyle) ran on varying types of anti-immigration platforms – they took 6% between but support climbed above 10% in Priorswood, Darndale and Coolock.
DUBLIN NORTH-WEST
Dublin North-West lost parts of the west and north of the Constituency to Dublin Fingal West and Dublin North- West – in return parts of Beaumont came in from Dublin Bay North in the east.
The Constituency returned three TDs : Dessie Ellis TD (Sinn Féin), Paul McAuliffe TD (FF) and Rory Hearne (SD). Cathleen Carney-Boud came fourth.
Roughly two-thirds of the vote came from the Ballymun-Finglas Electoral Area in the west – this includes heavily working-class Ballymun and Finglas as well as the more socially mixed Ballygalll and parts of Glasnevin. In the east one-third of the vote was cast in the parts of Artane-Whitehall and Clontarf electoral areas going in the constituency – again this area tended to be more socially mixed, the main areas being Whitehall and Beaumont.
Sinn Féin polled well in Finglas and Ballymun, though their vote was down from last time. Hearne topped the poll in a competitive Ballygall, though Rock did manage to get ahead in Glasnevin. McAuliffe topped the poll in north-east Finglas and also in Beaumont in the Eastern edge of the constituency (which was in Dublin Bay North last time).
CANDIDATE
B’MUN-FINGLAS
ARTANE – W’HALL
Hearne (SD)
11%
20%
McAuliffe (FF)
12%
16%
Ellis (SF)
23%
6%
C-Boud (SF)
13%
14%
Rock (FG)
7%
20%
TDS AND RUNNERS-UP
HEARNE (SD) polled best in Whitehall taking roughly a quarter of the vote. He also took over 20% of the vote in Ballymun Library, North Glasnevin and in parts of Beaumont. His vote fell to 5% in the more working-class parts of Ballymun and Finglas.
McAULIFFE (FF) took a quarter of the vote in north-east Finglas. He polled at least 10% in all Finglas polling stations bar Rivermount (7%). He also took over 20% in much of Beaumont. He only took about 4% in Ballymun proper.
ELLIS (SF) took over 30% in three polling stations, the highest being 43% in Rivermount. He was under 10% in much of Beaumont. His running mate Carney-Boud (SF)
DUBLIN SOUTH-CENTRAL
Dublin South-Central returned four TDs – Catherine Ardagh (Fianna Fáil), Aengus O’Snodaigh (Sinn Féin), Maire Devine (Sinn Féin) and Jen Cummins (Social Democrats).
Dublin South-Central was arguably the most left-wing in the country in 2020, returning three left-wing parties (Sinn Féin, Solidarity-People Before Profit, Independents 4 Change) and one Centre-Left one (the Greens).
This time, the Constituency was on paper even more working-class, with the transfer of of mainly middle-class areas in Templeogue and Terenure in the south of the Constituency going into Dublin South-West. Indeed, the combined FF/FG vote fell to under a quota from 22.7% to 18.9% (mainly due to a slide in the Fine Gael vote) – but the transfer between the two parties was greatly increased from 30% (Fianna Fáil to Fine Gael) in 2020 to 51% (Fine Gael to Fianna Fáil) in 2024. A 51% transfer in 2020 would have seen Fine Gael take the final seat at the expense of Independents For Change.
Dublin South-Central this time was incredibly competitive – the top candidate (Aenghus O’Snodaigh) only got 60% of a quota on the first count, and no less than nine other candidates got over half his vote (ie over 30% of a quota). That said, at the end of the day the top four candidates on the first count were the candidates eventually elected on the 14th and 15th counts.
The fascinating battle in this constituency was between Jen Cummins (Social Democrats) and Hazel De Nortuin (Solidarity-People Before Profit) who was hoping to succeed Brid Smith. Cummins started just 16 votes ahead of De Nortuin, but fell behind her on the 3rd count and didn’t regain the advantage until the tenth count (Green transfers) but went behind again by 434 votes on the 13th count (Right 2 Change transfers), only to be thrown well ahead on the 14th count (Labour transfers).
A summation of the main transfers can be seen below
COUNT
PARTY
VOTES
SF
FF
SD
PBP
R2C
FG
LAB
8
IFP
1,326
11%
1%
2%
7%
9%
1%
2%
9
AON
2,178
21%
8%
5%
8%
10%
4%
3%
10
GP
2,372
4%
10%
31%
6%
4%
11%
33%
11
FG
3,451
5%
51%
6%
3%
5%
14%
13
R2C
3,960
26%
12%
12%
25%
9%
15
LAB
4,333
12%
20%
44%
13%
SELECTED TRANSFERS
A few interesting things to note here….
Firstly more than a quarter of the Irish Freedom Party (IFP) vote went to left-wing candidates (SF/PBP/R2C) – only about 6% went to centre-left candidates (LAB/GP/SD) and a mere 2% went to Fianna Fáil and Fine Gael. A further one-third went to Aontu. Clearly the transfer pattern was a pro/anti-establisment one rather than a classic left-right one.
A similar-ish pattern can be seen on the next count where nearly 40% of the Aontu transfers went to left-wing candidates.
Nearly two-thirds of the Green vote went to fellow centre-left parties the Greens and the Social Democrats.
Half the Right 2 Change vote went to Sinn Féin and People Before Profit, but what caught the eye here was that 12% went to Fianna Fáil – a very high transfer rate for that combination.
Finally, nearly half the Labour vote went to the Social Democrats, ensuring that they would take the last seat ahead of People Before Profit.
Below is a map showing the Poll-Toppers in selected polling stations.
O’Snodaigh and Doolan shared the big Sinn Fèin vote in Ballyfermot, while Devine topped the poll in the Coombe area of the city. Cummins topped the poll between there and the South Circular Road. Collins and Ardagh both topped the poll in stations in Crumlin and the latter also topped the poll in Walkinstown. Seery-Kearney topped the poll in Chapelizod.
Below is a table showing the results by LEA. Just under half the votes cast were from Ballyfermot-Drimnagh, and just over a quarter each from South-West Inner City and Kimmage-Rathmines.
For the Right-Wing figure, I’m including “Far Right” candidates Independent Dolores Webster, and the the Irish People and Irish Freedom Party candidates as well right-leaning candidates Independent Phillip Sutcliffe and Aontu.
CANDIDATE
B’FERMOT-DRIMNAGH
SWIC
KIMMAGE-R’MINES
Ardagh (FF)
10%
10%
12%
Cummins (SD)
5%
14%
10%
O’Snodaigh (SF)
15%
7%
12%
Devine (SF)
7%
14%
12%
De Nortuin (PBP)
12%
8%
6%
SF Total
37%
24%
28%
FF/FG Total
18%
19%
20%
SD/GP/LAB Total
13%
36%
17%
PBP/R2C Total
19%
11%
19%
Right-Wing Total
12%
7%
10%
TDS AND RUNNERS-UP
Whats interesting here is that the difference between the “Left” (SF/PBP/R2C) and the “Establishment” parties (FF/FG) is actually less than that between the Left and the Centre-Left (LAB/SD/GP). Take for instance Ballyfermot-Drimnagh where the combined vote for the Left was 56%, more than four times the vote for the Centre-Left – however to the east in the South West Inner City, both blocs took just over a third of the vote.
ARDAGH (FF) polled best in parts of Crumlin, Drimnagh and Walkinstown, peaking at 19% in Crumlin Scout Hall. Her lowest poll was 3% in Cherry Orchard.
O’SNODAIGH (SF) polled best at just over 15% in Ballyfermot, performing best in the Family Resource Centre at 20%. He also polled decently in Drimnagh and Crumlin.
CUMMINS (SD) polled best in the South-West Inner City, peaking at nearly a quarter of the vote in Donore Avenue just north of the canal. She also polled decently in adjacent parts of Crumlin, but took a negligible vote in Ballyfermot.
DEVINE (SF) polled best in the parts of the Inner City closer to the Liffey, peaking at 17%. She also polled decently in parts of Crumlin.
Of the other candidates, Doolan (SF) polled very well in Ballyfermot proper – taking over a quarter of the vote there – but failed to attract many votes elsewhere. De Nortuin (PBP) took a very healthy 17% in Ballyfermot but otherwise she polled a fairly constant 6 to 8% across the Constituency rising to 10% in parts of the Inner City. Seery-Kearney (FG) topped the poll in the middle-class enclave of Chapelizod (21%), but was unable to gain traction in much of the rest of the constituency.
The Joint Tally for right-wing candidates showed highest support in Central Drimnagh and South Ballyfermot at 15%. It was lowest in the Basin Street area of the Inner City at 6%.
DUBLIN BAY SOUTH
There was a very minor adjustment here with Harold’s Cross going into Dublin South-Central.
Dublin Bay South is predominantly middle-class but still has a significant working-class presence in the Inner City and Ringsrnd. It also has a very high proportion of renters.
It returned four TDs – Cllr James Geoghegan (FG), Ivana Bacik TD (LAB), Jim O’Callaghan (FF) and Cllr Eoin Hayes (SD). Chris Andrews of Sinn Féin was the runner-up.
Dublin Bay South – or more appropriately its predecessors Dublin South-East and Dublin Townships – were always strongholds for Fine Gael up until the turn of the century.
In 1938 – when Fianna Fáil took 52% of the national vote – Fine Gael took two out of three seats in Dublin Townships. In Dublin South-East, they took two out of three in both 1954 and 1973. The Constituency revision of 1980 saw the Constituency assume the boundaries pretty much as it today.
The real battle for the last seat was between Sinn Féin’s outgoing TD Chris Andrews (4,872 votes, 12.2%) and Social Democrat Eoin Hayes (3,615 votes, 9.1%). Crucially for Hayes he started off 365 votes ahead of Cllr Hazel Chu of the Green Party. Given the narrowness of the margin, one would wonder if the result had been different if Eamon Ryan had stood again.
The following tables shows the important transfers during the count.
COUNT
PARTY
VOTES
FG
FF
LAB
SD
SF
GP
5
PBP
1,413
<1%
1%
10%
45%
25%
8%
8
GP
3,680
23%
4%
43%
22%
4%
10
FG
2,693
88%
11%
1%
11
FF
1,794
44%
5%
12
LAB
585
45%
6%
SELECTED TRANSFERS
The first major transfer was that of People Before Profit’s Brigid Purcell (1,413 votes) on the fifth count. Only 1% went to the three Fianna Fáil/Fine Gael candidates combined. A quarter of the transfer went to Sinn Féin, but nearly half went to the Social Democrats – by contrast only 18% went to the two other Centre-Left parties. One would suspect that the Social Democrats’ purity not being tainted by a recent spell in Government is a factor. The gap between Andrews (5,518) and Hayes (4,361) after this count was 1,157.
The next two counts consisted of the Independents O’Connell and Delahanty. Roughly one-third of O’Connell’s votes went back to her erstwhile Fine Gael colleagues. O’Connell’s votes slightly favoured Hayes, while Delahanty’s slightly favoured Andrews. At the end Andrews’ lead was slightly extended to 1,236 votes. Incidentally, Delahanty’s votes also put Hayes marginally ahead of Emma Blain (FG)
The eighth count saw the transfer of the Green Party’s Cllr Hazel Chu’s 3,680 votes. Two-thirds went to the other centre-left parties with Labour (43%) being favoured over the Social Democrats (22%) by nearly two to one. Of the other parties, Fine Gael received 22% and Fianna Fáil and Sinn Féin only 4% each. The difference in the transfers to Fine Gael and Fianna Fáil – despite the FFG jibes, Green voters at least seem to discern a sizeable difference between the Civil War. Overall the transfer patterns seem to suggest that current Green voters are on the centrist side of the Centre-Left voting bloc. Andrews’ lead was reduced by exactly seven hundred votes to 536.
The next count saw the transfer of Cllr Emma Blain’s votes 5,517. Nearly 70% went to her running mate Cllr James Geoghegan who was elected as was Ivana Bacik (LAB). Andrews’ lead was further reduced to just 466 votes.
On the tenth count, Geoghegan’s surplus of 2,693 votes was distributed. Well over two thousand (88%) went to Jim Callaghan (FF) electing him, 11% to Hayes (SD) and a mere 1% to Andrews whose lead was now only 191 votes.
On the eleventh count, Callaghan’s (FF) 1,794 surplus (via FG) was distributed. Only half the papers were transferable but of those that were went nearly 9 to 1 to Hayes over Andrews, leaving the latter 496 votes behind.
The last throw of the dice for Andrews was Bacik’s 585 vote surplus, but given that the votes had come via two Fine Gael candidates, the auspices were not favourable. And so it was with a very similar transfer to the previous count – Andrews only got 36 votes compared to 263 for Hayes whose final margin of victory was 723 votes.
The transfer pattern reminds me of an old sitcom : “Everybody Hates Chris”
CANDIDATE
P’BROKE
K-R’MINES
SEIC
Geoghegan (FG)
22%
13%
7%
O’Callaghan (FF)
16%
15%
9%
Bacik (LAB)
14%
14%
15%
Hayes (SD)
8%
7%
12%
Andrews (SF)
30%
6%
7%
FG Total
34%
25%
13%
TDS AND RUNNERS-UP
JAMES GEOGHEGAN (FG) topped the poll in much of his Pembroke bailiwick, being strongest in the Sandymount, Ballsbridge and Donnybrook areas – his best polling station was in Sandymount at 29%.
JIM O’CALLAGHAN (FF) topped the poll in just one polling station (Haddington Road, 15%), though he actually polled above that level in seven other polling stations. He polled best in Donnybrook (20%) and Ballsbridge (18%).
IVANA BACIK (LAB) put in a solid performance, demonstrating that her bye-election was not in a flash in the pan. She topped the poll across the Western border of the constituency from North of the canal down to Rathgar and Terenure. She polled best in the Portobello area just north of the Canal taking roughly a quarter of the vote.
HAYES (SD) had a vote pattern quite similar to Ivana Bacik. He narrowly bested her in one polling station in Harold’s Cross.
Andrews (SF) polled strongly in the part of the inner city east of Trinity College and in Ringsend, taking just over 40% of the vote. However it wasn’t enough to offset his low vote take South of the canal and the “Everybody Hates Chris” nature of the transfer patterns took their toll.
Incidentally, Fine Gael’s best Polling Stations were Gilford Road (Sandymount) at 42% and Ballsbridge (41%).
DUBLIN FINGAL WEST
The new Fingal West is a bit of a Frankenstein of a constituency – four sizeable towns on or near the coast in the north-west, a large rural area across the west interspersed with farms and villages relatively untouched by the urban sprawl and in the far south the suburbs of Meakstown and Santry on the northern edges of the city.
Three TDs were returned – Louise O’Reilly TD (Sinn Féin), Cllr Robert O’Donoghue (Labour) and Grace Boland (Fine Gael). Balbriggan-based Independent Cllr Tony Murphy was runner-up.
Of the three TDs, two were from the Balbriggan Electoral Area (O’Reilly and Boland) and one from Rush-Lusk. All three were from the north-east coastal area.
COUNT
PARTY
VOTES
FF
FG
SF
LAB
IND
2
Mixed
1,101
3%
2%
11%
5%
27%
3
Aontu
1,486
9%
5%
19%
7%
35%
6
FF
4,882
55%
25%
11%
On the first count, Louise O’Reilly (Sinn Féin) was comfortably ahead with 6,965 votes – less than six hundred votes below the quota. Labour’s ‘Robert O’Donoghue (5,044 votes), Fine Gael’s Grace Boland (4,583 votes), Fianna Fáil’s Lorraine Clifford-Lee (4,417 votes) and Independent Tony Murray were all in competition for the other two seats.
The second count consisted of the elimination of the candidates of three far-right/anti-immigration parties – Irish People / Irish Freedom / Liberty Republic as well as a left-leaning Independent. Most of the transfers (86%) came from the right-wing candidates, and the majority of the transfers went to Aontu (29%) and Tony Murphy (27%). This narrowed the gap between Clifford-Lee and Murphy to 566 votes.
The elimination of Aontu’s Robbie O’Loughlin on the tthird count saw that margin drop to just 192 votes. At the same time, Clifford-Lee closed the gap with Boland to just 105 votes.
The fourth count saw the joint transfer of the Green and Solidarity votes. Boland (14%) got nearly twice as many as Clifford-Lee (7%), which can be partially attributed to the Greens’ Joe O’Brien and Fine Gael’s Grace Boland sharing a base in Skerries. Furthermore, Tony Murphy closed the gap to 67 votes.
The fifth count saw the distribution of the Sinn Féin surplus of 731 (via Greens/Solidarity). Just over half went to Labour, but one fifth went to Tony Murphy – enough to put him of Lorraine Clifford-Lee by 38 votes.
The sixth and final count was the distribution of Clifford-Lee’s vote over half of which went to Boland and a further quarter to O’Donoghue – enough to put them both well over two thousand votes ahead of Murphy for the final two seats.
CANDIDATE
B’BRIGGAN
RUSH-LUSK
SOUTH
O’Reilly (SF)
24%
20%
31%
O’Donoghue (LAB)
8%
29%
8%
Boland (FG)
18%
12%
15%
Murphy (IND)
19%
5%
2%
Clifford (FF)
11%
19%
16%
TDS AND RUNNERS-UP
O’REILLY (SF) took votes across the Constituency. She took a third of the vote in the largest town (Balbriggan) in the far north of the Constituency, but also took 36% in Meakstown on the northern edges of the city, and nearly half the vote in Rivermeade/Toberburr, a housing estate about half a mile to the west of Swords.
O’DONOGHUE (LAB) built on the promise of his excellent election performance in the local elections (Labour took 40% and two of the five seats in Rush-Lusk) to easily take the second seat. He took 43% in Lusk and 34% in Rush and together the two towns account for nearly two-thirds of his vote. Elsewhere he took 12% in Santry and Skerries.
BOLAND (FG) owes her seat to a strong performance in Skerries (30%). She also polled well in rural areas, topping the poll in Oldtown (25%) and Loughshinny (22%).
Of the other candidates, Tony Murphy took 30% of the vote in Balbriggan, but was outpolled by O’Reilly. He did top the poll in nearby Balrothery (33%), but given that his campaign was very much focused on Balbriggan and adjacent areas his vote take fell short. Clifford-Lee (FF) polled strongly in the rural parts of the constituency – St Margaret’s 35%, Ballyboughal 31% – as well taking a decent vote out of Rush (20%), but was narrowly bested by Boland in the battle for the one government seat. She was unfortunate that her home area of Donabate/Portrane was not included in the constituency, but at the same time if Murphy had been excluded his votes may have favoured Boland somewhat on the basis of geography. O’Brien (GP) saw his vote cut in half by the redtaw, and the ebbing of the Green tide as well as the challenge from Boland in Skerries (where he took 15%) saw his fate sealed on the first count. Edwards (PBP) polled best in the Dublin city boxes taking 8%. Laughlin (AON) didn’t make an impact generally, but took a respectable 15% in the Meakstown boxes
DUBLIN FINGAL EAST
Dublin Fingal East is – unlike its sister constituency Fingal West – almost entirely Urban. The main settlements are Swords, Malahide and Portmarnock. It is one of the more middle-class constituencies in the Dublin Area, but there is a significant working-class population particularly in Swords.
The Constituency returned three TDs – Darragh O”Brien TD (FF), Cllr Louise Graves (SF) and Duncan Smith TD (LAB). Alan Farrell TD (Fine Gael) was the runner-up.
The Constituency was somewhat remarkable for the failure of Fine Gael to retain a seat in a mainly middle-class constituency and key to this was Alan Farrell’s failure to outpoll Darragh O’Brien (FF) in strongly middle-class Malahide and Portmarnock – in the 2020 General Election Fine Gael generally out-polled Fianna Fáil by about 2 to 1 (or more) in areas with similar demographic profiles.
COUNT
PARTY
VOTES
FF
SF
LAB
FG
OTH
4
IFP
675
4%
8%
3%
2%
75%
5
PBP
791
4%
21%
13%
1%
60%
8
GP
1,483
3%
34%
22%
36%
9
AON
2,140
16%
11%
11%
36%
10
I4C
3,428
23%
24%
9%
21%
11
SD
5,774
22%
51%
13%
The second count saw the elimination of Ben Gilroy of Liberty Republic (formerly Direct Democracy Ireland) with 318 votes – nearly half went to the Irish Freedom Party, another quarter to Aontu. When the IFP was eliminated two counts later nearly 40% went to Aontu.
On the 5th count, the Social Democrats were surprisingly the largest recipients (29%) of the People Before Profit vote, ahead of both Sinn Féin and Independents For Change who both took about a fifth of the votes.
The GP transfers on the 8th count went predominantly to the Centre-Left, but 22% went to Fine Gael – and only 3% to Sinn Féin. In fact Graves was only 10 votes ahead of Farrell after this count.
The largest recipient of Aontu transfers on the 9th count was Dean Mulligan (I4C) who took 548 votes (26%) which is arguably evidence of an establishment/anti-establishment transfer trend in play. Interestingly, 45% of the I4C transfers on the 10th count went to the centre-left parties (LAB and SD) and only 23% to Sinn Féin.
Finally, the Social Democrat vote transferred decisively to Labour leaving Duncan Smith more than three thousand votes ahead of Alan Farrell – Ann Graves had over eleven hundred votes to spare.
Below are the figures for the main area – just over 10% of voters voted in Donabate (and Portrane), while about 45% did so in both Swords and Malahide-Portmarnock (which also includes the Kinsealy area).
CANDIDATE
SWORDS
MAL-PORT
D’BATE
O”Brien (FF)
14%
34%
9%
Smith (LAB)
17%
9%
27%
Graves (SF)
21%
9%
13%
Farrell (FG)
11%
18%
13%
Hopkins (SD)
8%
13%
12%
FF Total
16%
37%
11%
TDS AND RUNNERS-UP
O’BRIEN (FF) swept the boards in Malahide (39%) and also topped the poll in Portmarnock (29%). He also topped the poll in the Kinsealy area.
SMITH (LAB) topped the poll in Donabate and Portrane (part of the Rush-Lusk area where Labour polled 40% in June 2024) with 26%. He also polled very creditably in Swords (17%), topping the poll in the North-West of the town with 26% of the vote.
GRAVES (SF) topped the poll in Swords (21%) and also in five of the six polling stations in the town.
Of the other candidates, Farrell (FG) polled best in Portmarnock (20%) but even there he was outpolled by Darragh O’Brien. Hopkins (SD) polled creditably to come fifth, particularly in the east of the constituency.
DUBLIN WEST
5
Dublin West upgraded from a four seater to a five-seater this time without any significant change in its boundaries. The constituency consists of middle-class areas in the south of the constituency (Castleknock, Navan Road) and more working-class areas to the North (Mulhuddart, Tyrrellstown).
Five TDs were elected – Jack Chambers TD (Fianna Fáil), Paul Donnelly TD (SF), Cllr Emer Currie (FG), Ruth C oppinger (Solidarity) and Roderic O’Gorman TD (Greens). Ellen Troy (Aontu) was the runner-up.
COUNT
PARTY
VOTES
FF
SF
SOL
GP
AON
OTH
5
FG
206
40%
2%
3%
25%
6%
24%
8
FF
1,247
4%
8%
21%
11%
32%
9
NP
1,658
11%
6%
1%
41%
17%
11
SF
2,573
28%
5%
14%
22%
12
SD
3,094
36%
18%
6%
24%
13
LAB
4,039
20%
43%
11%
SELECTED TRANSFERS
*The fifth count Fi ne Gael transfers were a surplus consisting of Fianna Fáil votes
The first count saw the top three Candidates – Chambers, Currie, Donnelly – well ahead followed by Coppinger (SOL) on 3,552 votes, O’Gorman (FG) on 2,909 votes, Walsh (LAB) on 2,455 votes and Troy (AON) on 2,453 votes.
It was Troy who was to challenge for the last seat, and in fact she moved ahead of O’Gorman on the back of a hefty transfer from the National Party on the ninth count. O’Gorman only overtook her with a 43% Labour transfer on the last count leaving him with a final margin of victory of 1,077 votes.
Troy’s impressive performance came on the back of an impressive local elections for the party where they won seats in Castleknock and Ongar, and were narrowly touched off in Blanchardstown-Mulhuddart.
Incidentally, the largest portion of the Social Democrat transfers went to Ruth Coppinger (SOL) – in the process stymying John Walsh’s (LAB) of overtaking Roderic O’Gorman. Walsh’s transfers ensured that O’Gorman got back ahead of Troy on the final count.
CANDIDATE
C’KNOCK
CAB-GLAS
ONGAR
BLA-MUL
Chambers (FF)
26%
20%
17%
16%
Donnelly (SF)
11%
15%
27%
21%
Currie (FG)
20%
18%
9%
10%
Coppinger (SOL)
6%
9%
9%
10%
O’Gorman (GP)
9%
9%
3%
4%
Troy (AON)
6%
5%
5%
5%
FF Total
27%
21%
18%
18%
SF Total
12%
19%
29%
33%
TDS AND RUNNERS-UP
CHAMBERS (FF) topped the poll across much of the south of the constituency, reaching up to a third of the vote in central Castleknock. He also topped the poll in Clonsilla and parts of Blanchardstown.
DONNELLY (SF) did best in the north of the Constituency, taking over a third of the vote in Huntstown and Hartstown and also in the small part of West Finglas in the constituency.
CURRIE (FG) found herself playing second fiddle to Jack Chambers through much of the middle-class areas of the constituency, although she did top the poll in the Pellettstown area.
COPPINGER (SOL) polled broadly the same across the Constituency albeit dipping slightly in Castleknock. Her top poll was 13% in Pellettstown.
O’GORMAN (GP) polled much better in the south of the constituency than in the North. His best poll was in the Diswellstown area to the west of the M50.
Of the other candidates, Troy (AON) took votes across the Constituency but was highest in Blanchardstown and Castleknock. Walsh (LAB) polled in excess of 10% in the Blanchardstown area.
DUBLIN MID-WEST
Dublin Mid-West was created in 2002 taking in parts of Dublin West and Dublin South-West.
It currently consists of the suburbs of Lucan, Clondalkin and Pakmerstown as well as the towns of Rathcoole, Saggart and Newcastle and surrounding rural areas. It received an extra seat in the recent redraw.
Five TDs were elected – Eoin O’Broin and Mark Ward (Sinn Féin), Emer Higgins (FG), Shane Moynihan (FF) and Paul Gogarty (IND). Eoin O’Broin (SD) was the runner-up. Outgoing PBP TD Gino Kenny came 8th on the first count and was never in the running.
COUNT
PARTY
VOTES
FF
SF
FG
SD
IND
OTH
4
GP
650
10%
3%
21%
19%
18%
22%
7
AON
1,601
8%
12%
6%
5%
9%
34%
8
IFP
1,935
1%
17%
2%
2%
10%
53%
9
LAB
2,698
9%
15%
20%
25%
9%
18%
10
PBP
3,359
4%
7%
48%
13%
8%
11
II
3,691
7%
9%
10%
31%
13
FG
667
66%
10%
25%
SELECTED TRANSFERS
Eoin Broin (of the Social Democrats) started off 739 votes behind Paul Gogarty. By the 8th count (with the elimination of the Irish Freedom Party candidate) that deficit had stretched to over one thousand. However successive transfers from Labour and People Before Profit actually put O”Broin into the leaf by just over five hundred votes. However transfers from Independent Ireland and Fine Gael again reversed the placings to see Gogarty take the final seat by 891 votes.
Dublin Mid-West consists of the sprawling socially mixed suburb of Lucan across the North of the constituency, Palmerstown-Fonthill in the north-east which contains the suburb of Palmerston as well as heavily working-class parts of North Clondalkin, while the Clondalkin area consists of the more socially mixed parts of South Clondalkin as well as the towns of Newcastle, Rathcoole and Saggart.
CANDIDATE
LUCAN
PALMERSTON
C’DALKIN
O’Broin (SF)
15%
16%
27%
Ward (SF)
4%
24%
8%
Higgins (FG)
12%
5%
13%
Moynihan (FF)
12%
12%
7%
Gogarty (IND)
20%
5%
1%
O’Broin (SD)
6%
5%
8%
FF Total
12%
13%
11%
FG Total
27%
11%
17%
TDS AND RUNNERS-UP
O’BROIN (SF) polled best in the south of the constituency – there was clearly an agreed split with Mark W ard. He took 45% (Sinn Féin 57% overall) in Deansrath, 36% in Bawnogue and 34% in Knockmitten. 75% of his 1st count transfer went to Mark Ward.
WARD (SF) took the majority of the Sinn Féin vote in the north of the Constituency. He took 60% in Quarryvale (70% Sinn Féin total), 49% in Rowlagh (63% Sinn Féin total) and 36% in Neilstown (53% Sinn Féin total).
HIGGINS (FG) polled best in the towns of Rathcoole (29%) and Newcastle (25%) – but she also took over 10% in parts of Lucan (which was supposedly her running-mate’s fiefdom) and Clondalkin.
MOYNIHAN (FF) polled best in the northern part of the constituency, reaching 20% in parts of East Lucan.
GOGARTY (IND) saw his vote largely based in Lucan – neatly four-fifths came from the Lucan Electoral Area. Interestingly, it was far-right/right transfers (Irish Freedom/Independent Ireland/Aontu) transfers that were instrumental in getting him over the line.
Of the other candidates, O’Broin (SD) polled best in South Clondalkin taking about 10%. Casserly (FG) polled respectably in Lucan taking nearly 20% in places. Kenny (PBP) polled poorly – his best vote was 9% in Neilstown. De Courcy (II) took up to 10% in parts of Clondalkin.
DUBLIN SOUTH-WEST
This iteration of Dublin South-West has existed since 1981 (the previous Dublin South-West covered a different area) – it assumed much of its current form after 2002 when Clondalkin, Newcastle, Saggart and Rathcoole were hived off to form part of new Constituency of Dublin Mid-West.
Originally a predominantly working-class constituency centered on Tallaght, boundary changes since the millennium (addition of Rathfarnham and much of Templeogue, loss of Fettercairn) have made it a much more socially mixed constituency.
It returned five TDs – Sean Crowe (SF), John Lahart TD (FF), Colm Brophy TD (FG), Paul Murphy TD (RISE) and Cllr Ciaran Ahern (LAB). Cllr Alan Edge came from tenth on the first count up to being runner up by 1,780 voted.
As mentioned above, Dublin South-West historically was a working-class majority constituency and with the arrival of Mary Harney as a Progressive Democrat candidate, they failed to take a seat here between 1987 and 1997 and then again from 2002 to 2007.
Pat Rabbitte became the first hard-left candidate to take a seat here – as a member of the Workers Party – in 1997. He later of course made his way towards the political centre by way of Democratic Left and Labour. He and Eamonn Maloney took two of the four seats in 2011 for Labour, but party saw a total collapse in their vote in 2016 and didn’t even come close to retaining either seat.
CANDIDATE
TALLA C
TALLA S.
F’HOUSE-B’NABREENA
RATHFARNHAM-TEMPLEOGUE
Crowe (SF)
26%
26%
10%
8%
Brophy (FG)
7%
4%
11%
20%
Lahart (FF)
7%
4%
16%
16%
Ahern (LAB)
4%
2%
8%
14%
Murphy (PBP)
12%
13%
6%
5%
Edge (IND)
4%
2%
12%
3%
FF Total
20%
8%
22%
21%
FG Total
10%
7%
20%
28%
SF Total
33%
41%
17%
10%
TDS AND RUNNERS-UP
Dublin South-West consists of all or part of the following Electoral Areas – Tallaght Central, Tallaght South, Firhouse- Boherbabreena and Rathfarnham-Templeogue. Tallaght South is overwhelmingly working-class while Tallaght Central to the North is also majority working-class but has a greater social mix. Firhouse-Bohernabreena to the east is composed mainly of lower middle-class areas (with some working-class areas in the west ofvthe area) while Rathfarnham-Templeogue would have a relatively affluent population base.
Just over two-fifths of the vote was cast in the two Tallaght Electoral Areas, but only 36% of the vote due to lower turnout, particularly in Tallaght South.
The aforementioned area gave the Left candidates (Sinn Féin and People Before Profit) over half the vote with former Sinn Féin Councillor Paddy Holohan taking another 14%. The Left also polled well in Tallaght Central, although Fianna Fáil also polled decently here.
Firhouse-Bohernabreena saw Fianna Fáil take the most votes with Fine Gael and Sinn Féin close behind. Independent Alan Edge got the second highest number of votes, but his vote was actually down from his poll-topping vote in the Local Elections.
Finally Fine Gael were well ahead of the pack in Rathfarnham-Templeogue. The Left candidates took only 15% between them.
COUNT
PARTY
VOTES
FF
SF
FG
PBP
LAB
SD
OTH
IND
3
GP
1,944
13%
4%
24%
4%
33%
14%
1%
8%
5
AON
3,748
14%
22%
6%
5%
4%
5%
20%
6
SD
4,508
8%
12%
8%
19%
35%
13%
8*
FG
1,360
70%
1%
3%
19%
8%
9
SF
5,192
8%
44%
8%
16%
11*
FF
2,672
15%
53%
22%
SELECTED TRANSFERS
There were no great surprises during the count, with the top 5 candidates at the start all being elected at the end, but all the same it is quite interesting to see how Alan Edge managed to get from 10th count on the first count to runner-up.
The first count saw the elimination of the National Party candidate (1450 votes) and two Independents (246) – 31% of this transfer went to Aontu and 33%:to Independent (formerly) Sinn Féin Tallaght candidate Paddy Holohan.
Outgoing Green Party TD Francis Duffy was eliminated on the 2nd count with his votes being distributed on the third – surely one of the earliest exits of a sitting representative. 47% of his vote went to the other Centre-Left parties, but 37% went to their erstwhile coalition partners. Only 8% went to Left wing parties.
Paddy Holohan’s votes on the fourth count mainly broke for Sinn Féin (30%) and Alan Edge (20%) -which catapulted the latter from 10th to 7th place, ahead of Barnes (FG), Whelan (SF) and O’Mullane (SD).
The Aontu votes on the fifth count broke somewhat better for Sinn Féin and Fianna Fáil with one fifth also going to Edge.
The Social Democrats vote went one-third to Labour and also interestingly more to PBP than SF, suggesting an enduring reluctance amongst some left voters about the latter party. That said, the 292 votes Sean Crowe received was enough to put him over the quota.
The seventh count saw the elimination of Barnes whose votes went relatively strongly to her running mate Colm Brophy (71%). His surplus on the 8th count in turn went strongly to the Fianna Fáil candidates.
The elimination of Whelan (SF) on the 9th count saw nearly half her votes go to Murphy of People Before Profit which ensured the latter’s seat. Over a fifth of her vote was non-tranaferable.
The tenth count saw the elimination of Costello (FF) with 61% of her vote going to her running-mate John Lahart TD.
The 11th count saw the distribution of Lahart’s surplus of 2,672 votes but only 2,392 were distributable. This means that over 40% of the packet of votes that he received from Costello were undistributable. Ahern of Labour took over half of those that were, with Edge only slightly narrowing the gap with Murphy to finish 1,780 votes to the bad.
CROWE (SF) saw his vote disproportionately come from Tallaght -63% came from the suburb came from the suburb compared to 17% from Firhouse-Bohernabreena and 20% from Rathfarnham-Templeogue. His highest polls were in Killinarden (33%), Castlepark and Mountainpark (31%) and Kilnamanagh (30%).
BROPHY (FG) saw his vote heavily based in the north of the Constituency in the Templeogue-Rathfarnham area – 63% of his vote was taken here. One fifth was cast in Firhouse-Bohernabreena and one-sixth in Tallaght. His running mate also took the largest section of her vote from Templeogue-Rathfarnham.
LAHART (FF) also took a majority (51%) of his vote in Templeogue-Rathfarnham but nearly a third was cast in Firhouse-Bohernabreena. His best polls were in Knocklyon (23%) and Ballyroan (21%).
AHERN (LAB) had a support profile surprisingly similar to Colm Brophy’s – 65% from Rathfarnham-Templeogue, 22% from Firhouse-Bohernabreena and 14% from Tallaght. His best polls were 20% in Ballyroan and 18% in Rathfarnham.
MURPHY (PBP) took 58% of his support from Tallaght, 24% from Rathfarnham-Templeogue and 18% from Firhouse-Bohernabreena. His strongest area was Jobstown where he got 16% of the vote.
Of the other candidates, EDGE (IND) was less than two thousand votes behind Paul Murphy on the final count – if he had won four out of five of the TDs would have had a majority of their vote coming from the middle-class areas of the constituency. His best poll was in Firhouse (15%) – he didn’t top 10% anywhere else. COSTELLO (FF) took 55% of her vote from the working-class areas of the constituency, peaking in Oldbawn (19%) and Greenhills (22%). O’MULLANE (SD) took 12% of the vote in Walkinstown and 10% in Templeogue. WHELAN (SF) polled best in Jobstown (16%). She only outpolled her running-mate Sean Crowe in one polling station (Ballyboden); if Sinn Féin had attempted to balance the vote she may have threatened Paul Murphy for the final seat.
GALWAY EAST
Galway East returned 4 TDS – Sean Canney (Independent Ireland), Albert Dolan (Fianna Fáil), Pete Roche (Fine Gael) and Louis O’Hara (Sinn Fein). Declan Geraghty (Independent Ireland) was runner-up.
Galway East is unusual in that all four elected TDs come from the North-Western LEAs – Roche and Canney from Tuam, Dolan and O’Hara from Athenry-Oranmore. There are no TDs from Gort-Kinvara and Loughrea in the South or Ballinasloe in the East. Declan Geraghty of Independent Ireland was the eventual runner up – He is based in the Ballinasloe Area.
Below is a map of the Poll-toppers in selected polling stations.
Canney, Roche and Geraghty were all in competition in the north of the Constituency – and Roche was less than four hundred votes ahead of Geraghty on the first count and later fell behind him on the distribution of the Aontu votes. However, Clodagh Higgins’ transfers went over 60% to Roche to bring him to safety, leaving Geraghty finishing twenty four hundred votes behind O’Hara of Sinn Fein.
CANDIDATE
TUAM
ATHENRY
SOUTH
B’SLOE
Dolan (FF)
10%
37%
20%
18%
Canney (IND)
39%
27%
11%
9%
O’Hara (SF)
11%
16%
16%
11%
Roche (FG)
17%
11%
2%
13%
Geraghty (II)
8%
3%
6%
27%
FF Total
13%
43%
31%
25%
FG Total
20%
20%
22%
20%
TDS AND RUNNERS-UP
DOLAN (FF) managed to take a good vote across the constituency and topped the poll in two of the three biggest towns in the constituency. His top poll was in Monivea (63%) followed by nearby Gurteen.
CANNEY (IND) by contrast saw his vote largely – though not exclusively – concentrated in the Tuam area. He took up to two-thirds of the vote in communities to the west of Tuam Town such as Sylaun (71%) and Belclare (69%). He also took a decent vote out of the Loughrea area.
ROCHE (FG) was caught in a battle with Canney to his West and GERAGHTY (II) to his East. He polled best in an area roughly extending from Tuam to Mountbellew.
O’HARA (SF) saw his vote spread out across the Constituency, but he did narrowly top the poll in Gort (24%). He also did somewhat better in towns than he did in rural areas.
Of the other candidates, GERAGHTY (II) took a big vote out of the North-East of the constituency, but ran out of road (quite literally. Neither RABBITTE (FF) nor MADDEN (FG) were able to drive up the big local totals in the Portumna area to keep a seat in the South-East.
MAYO
Mayo teturned five TDs – Alan Dillon and Keira Keogh (Fine Gael), Dara Calleary (Fianna Fáil), Rose Conway- Walsh (Sinn Féin) and Paul Lawless (Aontu).
There are six electoral areas in Mayo, and five of them elected a TD – the exception was Swinford in the north-east. The main candidate in the area was Sinn Féin veteran Gerry Murray who polled very well locally but was unable to extend his base.
Each of the three main parties had ambitions of an extra seat but Paul Lawless (Aontu) came from 8th place and less than half a quota on the first count to take the final seat.
Lawless took nearly 40% of Independent Stephen Kerr’s vote on the sixth count to overtake Fianna Fáil’s Lisa Chambers and leave him less than one hundred votes behind Mark Duffy (FG) and Patsy O’Brien (IND, ex-FG). He overtook Duffy and O’Brien on the next count with a quarter of the transfers from Gerry Murray (SF).
CANDIDATE
C’BAR
BALLINA
W’PORT
B’MULLET
C’MORRIS
Walsh (SF)
13%
12%
13%
41%
7%
Dillon (FG)
38%
6%
6%
5%
8%
Calleary (FF)
3%
25%
3%
15%
6%
Keogh (FG)
3%
1%
38%
16%
1%
Lawless (AON)
5%
5%
3%
3%
13%
O’Brien (IND)
4%
1%
1%
1%
30%
FF Total
18%
28%
11%
24%
14%
FG Total
44%
32%
46%
23%
28%
SF Total
15%
24%
14%
42%
10%
TDS AND RUNNERS-UP
(The Ballina area also includes Swinford for this analysis)
CONWAY-WALSH (SF) polled well across across most of the Constituency, but particularly well in her base in rural north-west Mayo. She took over half the vote in Ballycroy (57%), Aghleam (54%), Binghamstown (57%), Shraigh (55%) and Pullathomas (59%). Fianna Fáil took 43% of the vote in this area (Belmullet) and two of the three seats in the local elections in June indicating that a large numbers of voters voted locally for FF, but nationally for SF (or at least the SF candidate).
DILLON (FG) increased his vote from last time, and this dominated the Castlebar area whereas last time he had competition from both Michael Ring and Lisa Chambers. His vote was extremely consistent across the Castlebar town boxes ranging from 35% to 45%. His vote peaked in Breaffy at 51%. Just under two-thirds of his vote came from the Castlebar Electoral Area.
CALLEARY (FF) polled well across the North of the constituency – one third of the vote in Ballina, 15% in Belmullet and Swinford. He was in close contest with DUFFY (FG) in Ballina and Swinford (32% and 11% respectively), but was prevented by Fine Gael strategists from seeking votes in Belmullet which cost him dearly in the end. Calleary did best in rural areas to tne South of Ballina Town.
KEOGH (FG) took two-thirds of her vote from the Westport area where she was enthusiastically pushed by Michael Ring. According to the tallies, she took exactly half the vote in Westport Town (55% in the Quay polling station). In the rural and mountainous areas to the west and south, she was in strong competition with MAXWELL (II) who took half the vote in Louisburgh and surrounding areas. She started some two hundred votes behind DUFFY (FG) but overtook him on the 4th court and maintained a lead from then on.
PAUL LAWLESS (AON) as mentioned above started off in eighth place, but benefited from transfers. He took 13% in the Claremorris area and 8% from Swinford, which indicates his vote was strongest in the north-east of the constituency and also explains the strong transfer he received from MURRAY (SF). He topped the poll in Knock (43%) and surrounding areas.
ROSCOMMON-GALWAY
Roscommon-Galway remained a three-seater in 2024, but with changes – it ceded a significant amount of territory on its south-western flank into Galway West, while North Roscommon was returned to the Constituency from Sligo-Leitrim. The changes would have adversely affected Michael FitzMaurice who lost over four thousand votes in the redraw.
Three candidates were elected : Michael Fitzmaurice (II), Claire Kerrane (SF) and Martin Daly (FF). Aisling Dolan of Fine Gael was runner-up.
Below is a map of the poll-toppers in selected polling stations.
As you can see, the image is rather cluttered – so instead I will do maps of the west and the east of the constituency below.
The result was virtually pre-ordained from the first count with FitzMaurice elected, Kerrane comfortably ahead and Daly having more first preferences than the combined totals of the two Fine Gael candidates. Dolan’s only chance was Independent (ex-FF) Eugene Murphy’s transfers breaking heavily for her but the opposite happened and she was 2,641 adrift at the death.
CANDIDATE
ATHLONE
BOYLE
ROSCOMMON
B’SLOE
FitzMaurice (II)
32%
22%
35%
27%
Kerrane (SF)
14%
27%
18%
18%
Daly (FF)
23%
25%
18%
21%
Dolan (FG)
18%
3%
7%
26%
FG Total
20%
16%
10%
27%
TDS AND RUNNERS-UP
FITZMAURICE (II) again put in a powerful performance, topping the poll in three of the four electoral areas and not falling below one-fifth of the vote in any of them. In geography-conscious rural Ireland that is some achievement. His top polls were along the border of Galway-Roscommon – Glinsk (80%), Cloonfad (74%), Williamstown (72%) – his best polls all lie along the R360/2 Claremorris-Athleague Road.
KERRANE (SF) put in a strong performance, particularly in the north of the Constituency. She polled very well in Ballaghdereen (52%) and surrounding areas (French park 44%, Brusna 43% etc.) suggesting she has a strong local bae. She also polled decently across the Constituency.
DALY (FF) polled strongest across the south of the constituency, polling 36% in Kiltoom and 50% in Ballyforan in South Roscommon near Athlone. Across the border in Galway, he took 65% in Ballygar and 51% in Castleffrench. He also took a very creditable 29% in Roscommon Town.
Of the other candidates, Dolan (FG) took a very creditable 43% in Ballinasloe, but her vote was suppressed in the rest of the Galway area due to the presence of Fitzmaurice. She also took decent polls in several rural Roscommon boxes. Murphy (IND, ex-FF) put in a respectable performance centered on his base in Strokestown (39%), but was stymied by FitzMaurice’s strength in mid-Roscommon.
CAVAN-MONAGHAN
Cavan-Monaghan remained a 5-seater in 2024, despite the loss of the small part of North-West Meath that had voted in tbe constituency in 2020.
Five candidates were elected – Matt Carthy and Cathy Bennett (Sinn Féin), Brendan Smith and Niamh Smyrh (Fianna Fáil) and David Maxwell (Fine Gael).
Three Candidates were from Monaghan (Carthy, Bennett and Maxwell) and two from (Smith and Smyth).
This led to an anomalous situation whereby the smaller county (population-wise) actually returned a majority of the Candidates.
Furthermore, Monaghan returned two Sinn Féin TDs and one Fine Gael TD, while Cavan returned two Fianna Fáil TDs. Robbie Gallagher (Fianna Fáil) and outgoing TD Pauline Tully (Sinn Féin) started in fifth and fourth position respectively but were overtaken by party colleagues.
This like Dublin South-Central was a very competitive constituency, and on the first count it was clear that there were several contests at play.
Could Cllr Sarah O’Reilly (Aontu) challenge for a seat at the expense of Fianna Fáil? Fine Gael only had the votes for one TD, would it be Cllr David Maxwell of Monaghan or would it be of their Cavan candidates? Sinn Féin had enough votes for two seats but who would accompany Matt Carthy back to the Dáil? If Fianna Fáil were to return two seats, would it be the two outgoing Cavan TDs or could veteran Senator Robbie Gallagher make a breakthrough.And how many seats would each county return?
The first thing to look at is the votes cast for candidates hailing from each county. According to the tallies, on the first count, 39,262 (just under 57%) of the votes had been cast for Cavan candidates, and 29,883 for Monaghan candidates – a lead of 9,379 votes. By the fourth count after the Elimination of six minor candidates, the lead had stretched to nearly eleven thousand votes.
However, the next four counts all involved the elimination of Cavan candidates, and the Cavan was down to under four thousand votes. Also importantly – the eighth count involved the transfer of Cootehill-based Fine Gael Councillor Carmel Brady. Virginia-based Councillor T.P.O’Reilly had closed the gap from between himself and Monaghan-based Councillor David Maxwell from 1,871 to 1,407 but it was to naught as over a thousand Brady votes crossed the border into Monaghan and O’Reilly was eliminated on the next count.
One observation I would make is that O’Reilly (T.P.) had three problems, the first obviously is the perennial Not Enough Votes problem (Cavan men are known to be notoriously frugal with their number ones); the second is a geography problem (Brady was based in Cootehill on the border with Monaghan), and therefore her voters might have been inclined to give the number 2 to Maxwell; but the third was Arguably alphabetical.
What I mean by this is that O’Reilly was possibly at a disadvantage due to the position of his name on the ballot paper. In other words, someone voting Brady #1 and looking to mark #2 and #3 for her Fine Gael colleagues will chance upon Maxwell’s name before they espy O’Reilly’s. Unless they have a particular preference (and a good few will) that is the likely order they will mark their paper. Now, in truth, it is unlikely that it played a pivotal role in his defeat – the margin was just too large – but it likely was a factor in tne size of that margin.
Speaking of O’Reillys, Bailieborough-based Cllr Sarah O’Reilly (Aontu, formerly Fianna Fáil) was hoping for two coins to flip heads – that Niamh Smyth TD would fail to overtake her Monaghan colleague Senator Robbie Gallagher, and that she (O’Reilly) would take a large chunk of Cllr Shane O’Reiily’s (Independent Ireland, also formerly Fianna Fáil) vote on his elimination. Unfortunately for her, neither was true – Niamh Smyth started 584 votes behind Gallagher, but the spate of Cavan eliminations led to her being comfortably ahead on the 9th count when he was eliminated. Meanwhile Shane P O’Reilly was eliminated on the seventh count, and just over a quarter of the transfers went to his Aontu namesake, putting her over seven hundred votes ahead of Smyth. However T.P.O’Reilly’s elimination on the 9th count saw them virtually level, and Gallagher’s elimination on t4he succeeding count put Smyth some sixteen hundred votes ahead. The Sinn Féin transfers did help close the gap somewhat, but on the final count O’Reilly was 819 votes behind Brendan Smith, who in turn was 172 votes behind Niamh Smyth. Excellent vote-balancing by Fianna Fáil – by accident or design – saved their seat.
A final note on both Sinn Féin Monaghan candidates taking seats at the expense of sitting Cavan colleague Pauline Tully. Tully started off 449 votes behind Monaghan Town-based colleague Cathy Bennett.. With the slew of Cavan eliminations , Tully had moved 275 votes ahead by the 9th count, but the elimination of Fianna Fáil’s Robbie Gallagher saw over five hundred votes stay local with Bennett and Tully was eliminated on the 12th count.
According to the Tally, Bennett got over one thousand votes in Cavan, and Carthy got nearly two thousand – by contrast Tully got less than two hundred in Monaghan. This suggests Sinn Féin may have been trying to optimise their vote split to try and take three seats, but instead cost a sitting TD her seat. Did they factor in that Sinn Féin are historically far stronger in Monaghan than Cavan? We are most unlikely to find out.
CANDIDATE
MON Nth
MON SC
CAVAN E
CAVAN W
Maxwell (FG)
17%
18%
1%
2%
Carthy (SF)
8%
33%
5%
6%
Bennett (SF)
37%
8%
3%
3%
Smyth (FF)
2%
6%
13%
7%
Smith (FF)
0%
1%
12%
30%
O”Reilly (AON)
5%
5%
11%
6%
Tully (SF)
0%
1%
16%
19%
Gallagher (FF)
24%
15%
1%
2%
FF Total
26%
22%
26%
39%
FG Total
18%
22%
24%
17%
SF Total
45%
42%
24%
28%
TDS AND RUNNERS-UP
First thing I would note is that in both East and West Cavan the Sinn Féin Monaghan candidates took approximately one third of the vote. I was a bit surprised by this as I expected that the Monaghan candidates would poll better in the east of Cavan which is surrounded by Monaghan to the North and East.
Looking at Cavan towns and villages close to the Monaghan border, the Monaghan Sinn Féin candidates took 58% of the Sinn Féin vote in Kingscourt, 63% of the vote in Shercock and 45% in Cootehill. But even further from the border they took 34% of the SF vote in Belturbet, 22% in Cavan Town, 35% in Killeshandra. Significant amounts.
Niamh Smyth took just over one-quarter of her vote in Monaghan (mainly south Monaghan). Apparently many years ago, Rory O’Hanlon had a similar base in South Monaghan extending over into East Cavan.
MAXWELL (FG) – Maxwell was a Councillor for the Monaghan Area, but actually polled slightly better in the Ballybay-Clones area. He polled best in Drum (the only Protestant-majority village remaining in Ireland) with 44% of the vote – his late father Cllr Noel Maxwell was a Grandmaster of the Monaghan Orange Lodge. He also polled well in Mullyash (43%), Latlorcan (31%) and Ardaghy (31%). Interestingly, a quick look at the Cavan tallies suggests that he didn’t benefit from the votes of Protestant Communities in Cavan to the same extent that previous Monaghan-based FG TDs Heather Humphreys or Seymour Crawford did.
CARTHY (SF) – Matt Carthy dominated much of the south of the county, taking almost exactly half the vote in Carrickmacross.He took almost exactly half the vote in Carrickmacross, and 57% in neghbouring Donaghmoyne. He also took 46% in Inishkeen and roughly a third of the vote in Castleblayney.
BENNETT (SF) – Cathy Bennett took well over half her vote in North Monaghan. She took one third of the vote in Monaghan Town, narrowly besting Fianna Fáil’s Robbie Gallagher, and was completely in the traditionally Republican rural areas of the town, taking over half the vote in Scotstown (51%), Tydavnet (52%), Carrickroe (54%), Killybrone (54%) and Knockatallon (72%). Interestingly she secured over 80% of the party vote in this area.
SMYTH (FF) – Niamh Smyrh pulled off something a houdini act for the third General Election in a row, yet again confounding the pundits by finishing in fourth place despite being seventh on the first count. That seventh was more impressive than it seems as East Cavan was a veritable bear pit this time, with five or six potential candidates in the hunt for votes. Such was the competition in Smyth’s base of Bailieborough, she only topped the poll in a handful of polling stations. Over a quarter of her vote came from South Monaghan.
SMITH (FF) – Brendan Smith topped the poll in Cavan Town (24%), and much of sparsely-populated West Cavan but he didn’t run up the totals high enough to make victory certain on the first count. His somewhat isolated geographical position also made somewhat less transfer-friendly – Niamh Smyth attracted 5,879 transfers during the count compared to 4,233 for Brendan. His highest polls included 57% in Bawnboy, 53% in Corran and 44% in Corlough.
O’REILLY (AON) – Sarah O’Reilly improved on her decent showing in 2020, but fell just short this time. She took 29% in Bailieborough and roughly the same in surrounding areas.
Of the other candidates, Pauline Tully seems to have lost her seat due to the large amount of votes the Monaghan Sinn Féin candidates took from Cavan. That said, she polled very respectably in her own bailiwick (BallyJamesduff 32%, Drumavaddy 36%, Crosserlough 31%). Robbie Gallagher improved his vote and put in a strong showing in Monaghan Town (only just being touched off by Cathy Bennett), but the transfers went against him.
Finally a bit of Trivia – Brendan Smith topped the poll both in Blacklion and sixty miles away in Kingscourt (where presumably they mumble in a different dialect of Cavanese, or indeed speak Monagholian…..). According to the Internet, travel time by motorised vehicle is just short of an hour and a half. It must be surely some kind of record.
Oh go on then…. another bit of trivia…. three Candidates by the name of O’Reilly topped the poll in polling stations mere miles from one another – Shane P O’Reilly (Independent Ireland) took 50% in Mullagh, T.P.O’Reilly (Fine Gael) took 32% in Virginia and Sarah O’Reilly (Aontu) took 29% in Bailieborough.
Between them they took 12,554 votes – well over a quota – so naturally it was assumed that an O’Reilly (for centuries the Taoisigh of East Breffni) would be restored to their rightful place of representation for the county.
Alas, the voters – either ignorant or uncaring of their duty – did not comply. That said, when Shane P. O’Reilly was eliminated, a very satisfactory 42% of his votes went to his kinspeoplle. However when T.P. exited, a pitiful 9% of his votes went to the last remaining O’Reilly candidate who fell just short.
They were clearly guided by more material and worldly motivations. Shameful.
DONEGAL
Donegal remained a five-seater in 2024, with Ballyshannon and Bundoran remaining in Sligo-Leitrim.
Donegal – like the other Ulster counties Cavan and Monaghan – has a sizeable Protestant Population and returned Protestant Independents (with a minor blip) from 1923 to 1961.
Five candidates were elected this time – Pearse Doherty and Padraig MacLochlainn (Sinn Féin), Charlie McConalogue and Pat The Cope Gallagher (Fianna Fáil), and Charles Ward (100% Redress).
This represents a gain for Fianna Fáil and 100% Redress at the expense of Fine Gael and Independent Thomas Pringle.
For the first time ever, Fine Gael failed to win a seat in Donegal. Incidentally – and I could be wrong here – Charles Ward is the first TD elected from the Finn Valley since 1957.
According to the Electorate figures, 53% of the Registered Voters were in (roughly) the old Donegal North-East area and 47% in the old Donegal Sth-West. Using the same boundaries, 51% of the votes were cast in the old Donegal North-East and 49% in South-West. (It should be remembered that seven DEDs in South Donegal are in Sligo-Leitrim).
However, on the first count – according to my calculations- nearly two-thirds of the vote went to candidates from the old North-East area. Much of the disparity was due to Pearse Doherty and Charles Ward – both based in the old South-West – collectively taking well over twelve thousand votes in the North-East.
According to the tallies, South-West candidates took 44% of the vote in tbe North-East, but North-Eastern candidates took only 13% of the South-West vote.
The distribution of Pearse Doherty’s surplus- most of which went to Padraig McLochlainn – narrowed the vote gap to 60-40%, but it never got any closer. On the last count South-West candidates had 66% of the vote, north-east candidates 34%. On the last count with an extra south-west candidate the margin was 63% to 37%.
The main contest was between Charles Ward (100% Redress) and Left-Wing Independent Thomas Pringle for the final seat. On the first count, Ward led Pringle by 1,573 votes. The elimination of Mary T Sweeney (Aontu) on the 12th count saw two-fifths of her vote go to Ward and put him 2,989 votes ahead. The margin was narrowed on the 14tb count by the elimination of Noel Jordan (SF) as two-fifths of his vote went to Pringle bringing the gap to 1,258 votes. However, that’s as good as it, and he was beaten by Charlie McConalogue (FF) by 1,288 votes on the final count (Ward was a further 31 votes ahead).
CANDIDATE
DNE
DSW
Doherty (SF)
20%
30%
MacLochlainn (SF)
23%
2%
Gallagher (FF)
5%
23%
Ward (100R)
12%
5%
McConalogue (FF)
17%
3%
Pringle (IND)
3%
11%
FF Total
23%
26%
FG Total
8%
10%
SF Total
44%
40%
TDS AND RUNNERS-UP
Looking at the Vote Profiles of the five elected TDs Gallagher, MacLochlainn and McConalogue took the vast majority of their vote from their respective areas (North-East and South-West) – by contrast, Doherty took two-fifths of his vote from the old North-East area, and in fact Ward took more than two-thirds of his vote from the North-East despite being from the Finn Valley. Looking at the local election results, it is clear that 100% Redress’s greatest support was in the North-East.
ELECTION
North-East
South-West
LE24
5,630 (15%)
1,769 (5%)
GE24
4,779 (12%)
2,049 (5%)
100% REDRESS VOTE STATISTICS
100% Redress won 3 seats in the North-East in the Local Elections, and 1 in the South-West. Charles Ward himself didn’t win in Lifford-Stranorlar. As can be seen, their support base was roughly the same in both elections.
DOHERTY (SF) once again pulled off a spectacular performance, taking a quota and a half and at least 10% of the vote in all seven Electoral areas. His best Electoral Area was Lifford-Stranorlar (39%) – in his home area of Glenties, he polled 35% but was narrowly outpolled by Pat The Cope Gallagher. Indeed he polled 51% in Lifford and 49% in Castlefin. In his base of Glenties he polled best in the northern half of the area, taking 52% in Min an Chladaigh and Magheragroarty.
Below are maps of selected Polling Stations in Lifford-Stranorlar and Glenties Electoral Area.
LIFFORD STRANORLAR AREA
GLENTIES AREA – SELECTED STATIONS
PADRAIG MacLOCHLAINN (SF) polled best In Inishowen – Carndonagh (37%) and Buncrana (28%) -but even there his running mate Pearse Doherty took a large proportion of the Sinn Féin vote – 28% in Buncrana, 38% in Carndonagh. Further West, Doherty actually went ahead of MacLochlainn – 61% in Letterkenny and 57% in Milford. MacLochlainn’s highest polls were in Buncrana (44%), Burnfoot (also 44%) and Muff (42%).
GALLAGHER (FF) returned to the Dáil for his fourth stint in the house at the age of 76 – his previous sessions were 1981-1997, 2002-2009 and 2016-2020. Over half his vote came from his Glenties base where he outpolled Pearse Doherty by 36% to 35%.. He drove up very high totals from his heartland in the centre of the area – two thirds of the vote in Dungloe, 63% in Meenacross and 56% in Burtonport.
SELECTED POLLING STATIONS IN THE GLENTIES ELECTORAL AREA
WARD (100R) lives in the Finn Valley, but he pulled over two-thirds of his vote from the old North-East area. He took a third of his vote in his home village of Drumquin and a quarter in nearby Glenmaquin. Despite being an East Donegal man now, he was born on Aranmore and topped the poll there with 35%.
SELECTED POLLING STATIONS IN THE LIFFORD-STRANORLAR ELECTORAL AREA
McCONALOGUE (FF) held the same vote as in 2020, which was satisfactory given the additional pressure from 100% Redress this time. He polled well across north Inishowen, taking a third of the vote in Craigtown and Gleneely, and 30% in Carrowmore and Illies.
SELECTED POLLING STATIONS IN THE INISHOWEN PENINSULA
PRINGLE (IND) saw his vote fall for the third election in a row and this time it proved fatal. He polled very well in his base – Killybegs 55%, Commons 57% – but having McNulty immediately to his West and Jordan to his East would not have helped his cause.
Below is a map of selected polling stations in the Donegal Electoral Area.
Of the other candidates, Fine Gael’s Nikki Btadley simply failed to land a blow in the greater Letterkenny area. Her party colleague John McNulty received strong support in his area (Kilcar 59%, Meenaneary 43%, Cashel 31%), but the lack of grá for Fine Gael beyond the parish sunk him. Jordan (SF) took a quarter of the vote in Donegal Town, 40% in Mountcharles and 46% in Keelogues but was always in Doherty’s shadow.
This post is goings tto look at how the transfer patterns changed between FF and FG where there was at least one candidate from each of the parties.
The reason I’m having a look at this is because the RTE exit poll included a finding that 30% of Fianna Fàil voters had given their second preference to Fine Gael (versus 39% for another Fianna Fail candidate)l while 32% of Fine Gael candidates would do similar (versus 37% for Fine Gael) which on the face of it are eyebrow-raising figures.
However it has to be remembered that in a decent number of constituencies either Fianna Fàil or Fine Gael (and sometimes both) only ran one candidate. By my count Fianna Fáil only ran one candidate in 13 constituencies (7 of which were in Dublin) while Fine Gael did similarly in 15 constituencies (only 4 of which were in Dublin). Clearly, Fianna Fáil were more conservative with their candidate strategy in Dublin, while Fine Gael were more conservative beyond the Pale.
The Poll question doesn’t seem to discriminate between those who vote Number 1 for Party X and then eschew the wiles of the second X Candidate to deliver their second preference to party Y, and those who are Party X partisans but there no second X candidate in their constituency to transfer to.
The table below shows Fianna Fáil and Fine Gael where there is at least one candidate from each party continuing in the race. There were were 23 Fine Gael transfers matching this criterion and 22 Fianna Fáil ones.
PARTY
FF
FG
OTH
NT
FF
49.6%
21.8%
21.8%
6.9%
FG
25.2%
54.2%
14.1%
6.2%
TABLE 1 – 2024 FF/FG transfers
The internal Fine Gael transfer rate was 5 points higher than their Fianna Fáil counterparts bur they were also more likely to transfer to their Fianna Fáil counterparts than vice versa. Fine Gael – in these circumstances – seemed less inclined to transfer to other parties and Independents.
There was also an interesting difference between Fine Gael transfer rates in Dublin and the rest of Ireland.
PARTY
FF
FG
OTH
NT
Dublin
15.8%
68.9%
11.1%
4.2%
Elsewhere
27.9%
50.0%
15.4%
6.7%
TABLE 2 – 2024 FG transfers by area
In Dublin, more than two-thirds of Fine Gael transfers stayed within the party in the four areas that at least one other Fine Gael candidate was available. The number of votes Fine Gael received in these transfers was over four times that which Fianna Fáil received.
By contrast – outside Dublin – only half the Fine Gael transfers returned to the party and nearly thirty per cent went to Fianna Fáil. A slightly larger percentage also went to other parties and Independents. It was a similar situation in 2020.
The reason I didn’t do a similar analysis for Fianna Fáil in 2024 was because they only had one small transfer in Dublin (Fingal East) which can’t be seen as representative. A similar situation pertained in 2020.
However in 2020, there were three internal Fianna Fáil internal transfers in Dublin – 57.5% went back to the party and 11.5% to Fine Gael which wasn’t much different from the figures outside Dublin (54.1% to 13.3%).
To be quite honest – there is not much you can deduce from that.
Anyway – how have the transfer patterns shifted over the three elections? First we will have a look at the Fianna Fáil transfers.
YEAR
FF
FG
OTH
NT
2016
53.9%
10.1%
23.4%
12.7%
2020
54.6%
13.0%
23.0%
9.4%
2024
49.6%
21.8%
21.8%
6.9%
TABLE 3 – FF transfers in the last 3 elections
Confidence and Supply from 2016 to 2020 provoked a modest increase in the FF-FG transfer rate, but the rise was much steeper in 2024 with falls in both the internal Fianna Fáil transfer rate and the percentage of Non-Tansferable votes..
YEAR
FF
FG
OTH
NT
2016
14.1%
56.8%
20.5%
8.5%
2020
19.4%
56.4%
16.4%
7.5%
2024
25.2%
54.2%
14.4%
6.1%
TABLE 4 – FG transfers in the last 3 elections
Fine Gael see a smoother rise in transfers to Fianna Fáil between 2016 and 2024, with a corresponding drop in transfers to other parties and the rate of non-transferable votes.
Now back to the original question – do the (apparent ) Transfer rates in the Exit Poll for Fianna Fáil and Fine Gael match up with the rates calculated above? Table Below.
TYPE
FF-FF
FF-FG
FG-FG
FG-FF
Exit Poll
39%
30%
37%
32%
GE24
49.6%
21.8%
54.2%
25.2%
TABLE 5 – Real vs Poll FF/FG Transfer Rates
A quick look at the figures above suggest definitely not. However if – for the inter-party transfers – we only include those constituencies where the transferring party has a candidate eligible to receive votes.
In Fianna Fláil’s case for instance, this meant that just over 82% of their total poll was potentially transferable to a party colleague.
(For Fine Gael the corresponding figure was just over 76%)
Extrapolating further, this means that the true internal transfer figure found for Fianna Fáil in the poll should not be thought off as 39/100 but rather 39/82.3 (and for Fine Gael, 37/76.1).
This leads to recalibrated internal transfer rates for both parties of just under 50% – but now I have to account for transfers to the other party (ie FF-FG) and then all transfers or non-transferable votes.
In the opinion poll those blocks for FF transfers are 30% and 31% respectively, equalling 61%. On the recalibration above, there is 52½% available due to the 47½% internal transfer rate for FF. Therefore the respective transfers should be accordingly proportionally reduced.
If we do that for both the Fianna Fáil and Fine Gael figures, the rejigged Table 4 looks like these.
TYPE
FF-FF
FF-FG
FG-FG
FG-FF
Exit Poll
47%
26%
49%
26%
GE24
49.6%
21.8%
54.2%
25.2%
TABLE 5 .1 – Real vs Poll FF/FG Transfer Rates
Now – I admit this isn’t exactly science, but it’s not an unreasonable work around (I think so anyway)
The figures don’t exactly match up – but they are close enough.
What is clear from the above analysis is that the (apparent) suggestion in the raw figures presented at 10pm on polling day that Fianna Fáil and Fine Gael voters were essentially transferring FFGesquely between the two parties is not true.
What is also true however is that there has been a steady growth in the transfer rate between the two parties in the ast decade with nearly a quarter of each party’s voters transferring to the other party when both choices were available.
The following is a rolling analysis of the 2024 Kildare count and tallies
WINNING CANDIDATES SUPPORT MAPS
Martin Heydon polled strongest in the villages and rural communities in and adjacent to the foothills of the Wicklow Mountains along the eastern border of the constituency. He polled relatively well across the rest of the constituency with the exception of Athy town and surrounding communities.
Siona Ni Raghallaigh (Sinn Féin) is based in Kildare Town (where she polled a respectable 22%), but her highest polling was amongst communities in the Bog of Allen in the north-west.
Mark Wall (Labour) took massive polls from his Athy heartland (65% in West Athy, 59% in East Athy) and good polls from surrounding communities. The party’s vote further north has not recovered greatly since 2016.
MATT CARTHY TD (SF) at 1/100 is priced by the bookies as a certainty, while they are also confident about the chances of his colleague PAULINE TULLY TD (SF) and Fine Gael’s Monaghan candidate Cllr DAVID MAXWELL at 1/5.
After that things get tricky. If the odds are to be believed no less than five candidates are in the running for the last two seats – BRENDAN SMITH TD of Fianna Fáil (8/11), Cllr SHANE P O’REILLY of Independent Ireland (4/5), Sen ROBBIE GALLAGHER (1/1) of Fianna Fáil, NIAMH SMYTH TD of Fianna Fáil (11/8) and Cllr SARAH O’REILLY (6/4) of Aontu.
Most Surprisingly – given that Fine Gael were runner-up last time – Fine Gael’s Cllr T.P.O’REILLY and Cllr CARMEL BRADY are priced at very long odds (11/1 and 16/1)
Brendan Smith’s odds are eye-catching given that he is the only major candidate standing from West Cavan.
DONEGAL (5 seats)
TIME
FF
FG
SF
GP
LAB
LEFT
OTHERS
IND
GE 2020
1
1
2
1
21/11/2024
2
2
1
The odds suggest that sitting Sinn Féin TDs PEARSE DOHERTY (1/200) and PADRAIG MacLOCHLAINN (1/16) are racing certainties. For the remaining three seats, there are less confident pricings for PAT GALLAGHER (FF – 1/3), CHARLIE McCONALOGUE TD (FF – 4/11) and THOMAS PRINGLE TD (IND – 1/2).
Charles Ward (100% REDRESS) closely follows them at 1/2. The Fine Gael candidates are both at 6/1, which suggests the Fine Gael seat is in big trouble.
The pricings are broadly in line with the findings of the TG4 poll on Tuesday.
GALWAY EAST (4 seats)
TIME
FF
FG
SF
GP
LAB
LEFT
OTHERS
IND
GE 2020
1
1
1
21/11/2024
2
1
1
Both Independent SEAN CANNEY TD (1/12) and Cllr ALBERT DOLAN (FF – 1/6) are long odds on for seats. Third and Fourth in the odds are Fianna Fáil’s ANNE RABBITTE TD and Cllr PETE ROCHE of Fine Gael.
Portumna-based NIAMH MADDEN (FG) is also 4/6. Cllr LOUIS O’HARA of Sinn Féin who was narrowly defeated for the last seat in 2020 is 11/4.
The additions of areas from Roscommon-Galway might allow both Roche and Canney to get elected in the north of the constituency, Dolan in the centre and a contest between Madden and Rabbitte in the east.
GALWAY WEST (5 seats)
TIME
FF
FG
SF
GP
LAB
LEFT
OTHERS
IND
GE 2020
1
1
1
2
21/11/2024
1
1
1
2
The odds suggest that sitting Independents TDs NOEL GREALISH and CATHERINE CONNOLLY are set for re-election at 1/8 and 1/5 respectively. However there are then six other candidates less than odds on – GRAINNE SEOIGE and JOHN CONNOLLY of Fianna Fáil, HILDEGARDE NAUGHTON and SEAN KYNE of Fine Gael, MAIREAD FARRELL of Sinn Féin and NOEL THOMAS of Independent Ireland.
Seoige, Thomas and Kyne will be contesting for the one likely Connemara seat, while John Connolly, Naughton and Farrell will be contesting for seats in the City.
MAYO (5 seats)
TIME
FF
FG
SF
GP
LAB
LEFT
OTHERS
IND
GE 2020
1
2
1
21/11/2024
2
2
1
ALAN DILLON TD (FG) didn’t poll that impressively last time, but he’s priced at an unbackable 1/100. Also strongly favoured to return is ROSE CONWAY-WALSH TD (SF) at 1/7.
Also odds-on are DARA CALLEARY TD (FF – 2/7), Sen LISA CHAMBERS (FF – 2/5) and Cllr MARK DUFFY (FG – 2/5). Cllr PATSY O’BRIEN (IND – 5/2) and Cllr PAUL LAWLESS (AON – 11/2) are both from the east of the county and both polled 7% in the recent TG4 poll.
ROSCOMMON-GALWAY (3 seats)
TIME
FF
FG
SF
GP
LAB
LEFT
OTHERS
IND
GE 2020
1
1*
1
21/11/2024
1
1
1*
* Independent Ireland
MICHAEL FITZMAURICE TD (II – 1/20), CLAIRE KERRANE TD (SF – 1/10) and newcomer MARTIN DALY (FF – 1/6) are all priced to win. The nearest competition is former FF TD Eugene Murphy (IND – 5/2) and Sen AISLING DOLAN (FG – 3/1). Dolan has lost a significant amount of her Galway base since 2020 in the redraw.
SLIGO-LEITRIM (4 seats)
TIME
FF
FG
SF
GP
LAB
LEFT
OTHERS
IND
GE 2020
1
1
1
1
21/11/2024
1
1
1*
1
* Independent Ireland
MARIAN HARKIN TD (IND – 1/10) and FRANK FEIGHAN (FG – 1/8) are priced for victory. Also odds on are Cllr MICHAEL CLARKE (II, ex-FF – 1/5) and Leitrim-based MARTIN KENNY TD (1/3).
Next in the market are the Sligo Fianna Fail duo, former TD EAMON SCANLON (1/1) and Cllr EDEL McSHARRY (5/4) – taken collectively there is roughly a 2/5 chance of a seat.
According to the odds, CATHAL CROWE TD (FF – 1/8) is the only sure thing, with Sen TIMMY DOOLEY (FF – 2/5), LEONORA CAREY (FG – 4/9) and Cllr JOE COONEY (IND – 4/11) more cautiously priced.
They are followed by Cllr DONNA McGETTIGAN (SF – 1/1) and European Election candidate EDDIE PUNCH (II – 5/4). Independent TD VIOLET-ANNE WYNNE (formerly of Sinn Féin) is at 12/1.
Government Candidates take up the first four positions, but it’s hard to see at least one non-government being elected.
CORK EAST (4 seats)
TIME
FF
FG
SF
GP
LAB
LEFT
OTHERS
IND
GE 2020
1
1
1
1
21/11/2024
1
1
1
1
According to the odds, JAMES O’CONNOR TD (FF – 1/14) is the only sure thing, with MARK STANTON (FG – 1/4), PAT BUCKLEY TD (FG – 1/3) and former FF Councillor WILLIAM O’LEARY (IND – 1/2) more cautiously priced.
Their main challengers are – according to the odds – Cllr DEIRDRE O’BRIEN (FF) who is the sister of former TD Kevin O’Keeffe, Cllr LIAM QUAIDE (SD) and Cllr NOEL HEGARTY (FG) who are all based at 2/1.
There is an effect an open seat in the seat in the Fermoy area in the north of the constituency which will be contested by O’Leary, O’Brien and Hegarty. Quaide is Midleton-based and has to contend with sitting Fianna Fáil and Sinn Fein TDs, as well as Mark Stanton attempting to succeed his father David Stanton.
CORK NORTH-CENTRAL (5 seats)
TIME
FF
FG
SF
GP
LAB
LEFT
OTHERS
IND
GE 2020
1
1
1
1
21/11/2024
1
1
2
1
According to the odds, THOMAS GOULD TD (SF – 1/20) is the only sure thing, with COLM BURKE TD (FG – 2/7), PADRAIG O’SULLIVAN TD (FF – 1/3) and Cllr KEN O’FLYNN (IND – 1/3) more cautiously priced.
The last seat – according to the odds – is between Cllr JOE LYNCH (SF – 1/1F), MICK BARRY (SOLIDARITY – 5/4) and Cllr JOHN MAHER (LAB – 11/8). There are likely two left seats – whether Sinn Féin or Solidarity will take the second is hard to say and may depend on the national mood. Labour will need to raise their vote to Maher over the line.
CORK NORTH-WEST (3 seats)
TIME
FF
FG
SF
GP
LAB
LEFT
OTHERS
IND
GE 2020
2
1
22/11/2024
2
1
Cork North West is regarded as the most predictable constituency in the country and the prices reflect that with TDs AINDRIAIS and MICHAEL MOYNIHAN of Fianna Fáil at 1/12 and 1/5 respectively and Cllr MICHAEL CREED of Fine Gael at 1/4. Cllr JOHN PAUL O’SHEA of Fine Gael is next at 4/7.
One price that stands out is BECKY KEALY of Aontu at 80/1. Kealy polled nearly four thousand votes in 2020, and narrowly lost out at the local elections.
CORK SOUTH-CENTRAL (5 seats)
TIME
FF
FG
SF
GP
LAB
LEFT
OTHERS
IND
GE 2020
2
1
1
22/11/2024
2
1
1
1
The Fianna Fáil duo MICHEAL MARTIN TD and Cllr SEAMUS McGRATH are long long odds on – in fact at 1/50 McGrath must be the shortest priced new candidate in the election. DONNCHADH O’LAOGHAIRE TD of Sinn Féin is also unbackable at 1/20.
For the final two seats, JERRY BUTTIMER (FG) and LAURA HARMON (LAB) are priced at 2/5, with SHANE O’CALLAGHAN (FG) and MICK FINN (IND) priced as the prime competitors.
I’m slightly sceptical about the strength of the Labour candidate in the betting, but at the same time they did win two seats in the local elections and their candidate is likely to benefit from Green and Social Democrat transfers.
CORK SOUTH-WEST (5 seats)
TIME
FF
FG
SF
GP
LAB
LEFT
OTHERS
IND
GE 2020
1
1*
1
23/11/2024
1
1*
1
Independent Ireland leader MICHAEL COLLINS heads the backing at an unbackable 1/50. Social Democrats Leader HOLLY CAIRNS is priced at 1/4.
For the last seat, poll-topping Clonakilty Fine Gael Councillor is priced at 3/10, putting him in direct competition with current Fianna Fáil TD Christopher O’Sullivan (1/1) who is also based in Clonakilty.
Tim Lombard (FG) who was narrowly beaten last time, is priced at 7/2.
KERRY (5 seats)
TIME
FF
FG
SF
GP
LAB
LEFT
OTHERS
IND
GE 2020
1
1
1
2
23/11/2024
2
1
2
Kerry Prices are very conservative with MICHAEL HEALY-RAE TD, DANNY HEALY-RAE TD, PA DALY TD and NORMA FOLEY are all long odds-on. Cllr MICHAEL CAHILL (FF – 1/3) is the bookies’ choice to take the final seat. BILLY O’SHEA (FG) and LINDA GORDON-KELLEHER (FF) are also competitive in the betting.
LIMERICK CITY (5 seats)
TIME
FF
FG
SF
GP
LAB
LEFT
OTHERS
IND
GE 2020
1
1
1
1
23/11/2024
1
1
1
1
WILLIE O’DEA TD (FF – 1/14) and KIERAN O’DONNELL (FG – 1/10) are both priced for a return to the Dáil. MAURICE QUINLIVAN (SF – 1/4) is next.
The last seat – on the odds – is between Cllr FRANKIE DALY (IND – 4/7), Limerick Mayoral candidate DEE RYAN (FF – 1/1) and Cllr CONOR SHEEHAN (LAB – 2/1)
LIMERICK COUNTY (5 seats)
TIME
FF
FG
SF
GP
LAB
LEFT
OTHERS
IND
GE 2020
1
1
1
23/11/2024
1
1
1
No surprises here as the three sitting TDs PATRICK O’DONOVAN (FG – 1/50), NIALL COLLINS (FF – 1/10) and RICHARD O’DONOGHUE (II – 1/10).
Everyone other than JOANNE COLLINS (SF – 2/1) are long odds – she was unsuccessful in the local elections in June.
TIPPERARY NORTH (3 seats)
TIME
FF
FG
SF
GP
LAB
LEFT
OTHERS
IND
GE 2020
1
1
1
23/11/2024
1
1
1
MICHAEL LOWRY TD (IND) is – surprise surprise – 1/200 in the betting. Cllr MICHAEL SMITH (FF) is 1/5 and ALAN KELLY TD (LAB) is 1/4; he will be competing with Cllr RYAN O’MEARA for supremacy in the western half of the constituency with Cllr RYAN O’MEARA (FF -5/6). Cllr JIM RYAN (IND) is 9/1 and all the rest are fancy prices.
TIPPERARY SOUTH (3 seats)
TIME
FF
FG
SF
GP
LAB
LEFT
OTHERS
IND
GE 2020
1
1
23/11/2024
1
1
1
MATTIE McGRATH TD (IND, ex-FF) is strongly odds-on. Next is Fine Gael Councillor MICHAEL MURPHY (FG – 1/4) who polled nearly two quotas in the Clonmel Electoral Area in 2024. The last seat according to the odds will be between Carrick-on-Suir poll-topper Cllr IMELDA GOLDSBORO (FF – 4/7), Cashel-Tipperary poll-topper Cllr JOHN O’HENEY (IND – 11/8) and former WUAG TD Seamus Healy (IND – 7/4).
Outgoing Sinn Féin TD Martin Browne is 8/1.
WATERFORD (4 seats)
TIME
FF
FG
SF
GP
LAB
LEFT
OTHERS
IND
GE 2020
1
1
1
1
23/11/2024
1
1
2
DAVID CULLINANE TD (SF-1/200) is unbackable. There are four odds-on candidates for the remaining three seats – MARY BUTLER TD (FF – 1/5), Sen JOHN CUMMINS (FG – 1/4), Cllr CONOR McGUINNESS (SF – 1/3) and MATT SHANAHAN TD (IND – 2/5).
MARC O’CATHASAIGH TD of the Green Party is 9/2.
McGuinness is the only one of the leading candidates from the west of the constituency which might help his cause.
his Poll Average was calculated by doing a time-rated average of the last five Irish Opinion Polls (with adjustments for each polling compant based on their historical deviation from the overall average of polls). Regional sub-data for Dublin and the provinces is also used to account for Regional Swings.
The main points of this Poll Average are :
The Government Parties (Fine Gael, Fianna Fáil, Greens) would take 86 seats – 43 for Fianna Fáil, 42 for Fianna Fáil and 1 for the Greens.
The Opposition Parties (Sinn Féin, Labour, Social Democrats, Solidarity-People Before Profit, Aontu) would take 47 seats – 31 for Sinn Féin, 2 for Labour and 14 for the other three parties.
Bear in mind that there 14 extra seats in the new Dáil.