- Less than ⅙ of households earn less than $35k per year
- Between ⅙ and ⅓ of households earn less than $35k per year
- Between ⅓ and ½ of households earn less than $35k per year
- Over ½ of households earn less than $35k per year

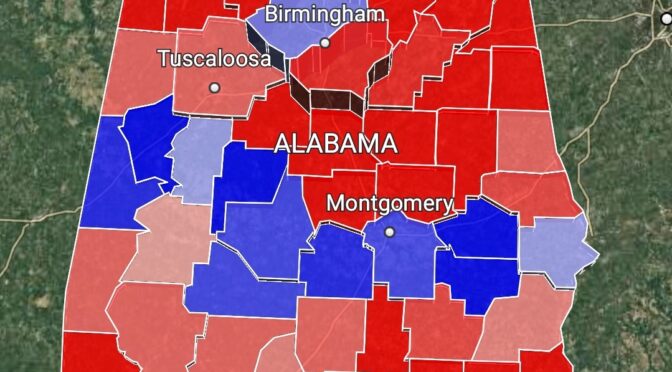
The only county where less than one-sixth of Households have an income of $35,000 or less is Shelby County, which includes the southern suburbs of Birmingham as well as affluent exurbs clustered along Interstate Highway 65 as well as a large number of Golf courses. The median family income in 2010 was just over $68gK. The proportion of White households decreased from 89% to 73% between 2000 and 2020 with corresponding rises in both Black and Hispanic households. The County voted reliably for Denocrats between 1868 and 1944 – except in 1928 when there was a backlash in the Southern Sates against Irish Catholic Democrat candidate Al Smith. Dixiecrats Strom Thurmond and George Wallace won in 1948 and 1968 respectively amidst a period of Republican dominance from 1956 until 2004 – since then the county has become Democrat-leaning.

Most of the counties where low-income households comprised between one-sixth and one-third of households voted Republican (23) versus only 2 for the Democrats – Montgomery and Jefferson. Jefferson is home to the city of Birmingham and its many suburbs. Birmingham was historically a white majority city but from the 1960s onward “White Flight” to the suburbs saw a marked decrease in both the city’s population and its white population share. The 2020 census shows that the city’s population continued to decline and had fallen by neatly half since its peak in 1960, but conversely the white share of the population increased marginally from 21% to 23%, while the Black share of the population fell from 73% to 68%. Birmingham was the scene of high levels of activity by the Ku Klux Klan in the 1950s, which served as a spur for the city to be an 8mportanr center of the Civil Rights movement in the 1960s. In the broader county the White share of the population fell to under half for the first time, possibly due to a small but growing Hispanic community.
In Montgomery City, there has been a rapid departure of White families from the city – in 2000, the White and Black populations was roughly equal, by 2020 the black population outnumbered their white counterparts by more than two to one. Montgomery City dominates Montgomery Coubty comprising over 80% of its population. Montgomery County was very much part of the Democratic “Solid South” from 1900 to 1944, with the Democratic vote frequently rising over 90% – however Dixiecrat Strom Thurmond won 88% of the vote in 1948; and fron 1956 until 1992 (except in 1968 when George Wallace won), the Republicans won every Presidential vote. Since then the county has fallen back into the Democratic column.
Counties where between a third and a half of Households earn less than $35k per year constitute most of the rural counties of the rural Black Belt which runs horizontally across south-central Alabama. Though taken these days as a reference to the group of rural counties with Black majorities, the term “Black Belt” originally referred to the fertile black soil that ran across this section of Alabama that made it especially suitable for Cotton cultivation which led to a large population of Black enslaved people across the Black Belt. Two typical counties in the east of the Black Belt are Macon and Bullock county.
Macon County was only established in 1832 and originally populated largely by slaveholders (and slaves) from further east. The population collapsed by one-third between 1860 and 1870 as newly freed ex-slaves went north to the cities or west to the frontiers in search of work and opportunity. The population gradually recovered reaching a peak of thirty thousand in 1950, but has been in near continuous decline since then, falling under twenty thousand in 2020. The Black population has fallen by nearly a quarter since 2000. In the same year, the average family income was only $21k. The Democratic Party only failed to win Presidential elections in Macon County three times since 1900 – in 1948 when Strom Thurmond ran as a Dixiecrat, in 1956 when Dwight Eisenhower won a narrow victory and in 1964 when electors pledged to George Wallace (who pulled out of the race) took a majority. Interestingly turnout in 1960 was 2,229 votes (Democrat vote 59%) compared to 6,381 votes (Democrat vote 69%), suggesting a massive enrolment of Black voters in the intervening years and a near seemless transition of the local Democratic Party from Dixiecratic to modern Democratic.
Bullock County – which lies directly to the south of Macon County – began to see development of cotton plantations from the 1830s (which involved clearing the forests that dominated the landscape as well as the native American Creek tribe), but wasn’t given County status till after the civil war. The cotton-eating Boll Weevil arrived in the County in 1877, eventually destroying the Cotton industry. The population peaked at just under thirty-two thousand in 1910 after which it entered a nearly continuous decline and by 2020 it was barely over ten thousand. Similar to Macon County, Bullock County was part of the Solid South with the Democratic Party thrice winning over 99½% of the vote – in 1904, 1920 and 1936 – in Presidential elections. Turnout figures – and voting patterns – suggest that between 1896 and 1904, the Democratic Party significantly reduced the franchise to remove most Black voters from the register. The Republicans took about a third of the vote in 1884 and 1888, the Progressives 43% in 1892. In that year over thirty-three hundred voters cast ballots – in 1904 only seven hundred did. As you might expect, Strom Thurmond won in 1948 and George Wallace in 1968. Barry Goldwater in 1964 was the only Republican win in the 20th century. Turnout increased from 1,169 votes in 1960 to over four thousand votes in 1972 when Nixon lost narrowly to George McGovern – no Presidential race since has been close. Similar to Macon County, household income was only just over $20k in 2000.

Finally, only two counties had in excess of more than 50% of households living on less than $35k per year. Greene County saw violent suppression of the Republican party by the KKK during the Reconstruction with four Republican politicians (black and white) killed in two years. Despite this, Republicans won Presidential votes until 1888. In the 1870s turnout was roughly three thousand and seven hundred per Election with the Republicans winning with roughly two thousand five hundred votes. By 1904, the Republicans won only 17 votes out of 494 cast. Strom Thurmond won in 1948 and Barry Goldwater in 1964; but since it has been a Democratic bastion. The population peaked at over twenty-four thousand in 1900 – it was just under eight thousand in 2020. Blacks outnumber Whites by Five to One. Perry County has a very similar history to Greene’s with the county losing three quarters of its population since 1880 – they both have very high obesity levels.
The following map uses Height to represent population size
- Level 1 – Counties with less than ten thousand voters
- Level 2 – Counties with between ten thousand and a hundred thousand voters
- Level 3 – Counties with between a hundred thousand voters and a Million voters
- Level 4 – Counties with over a million voters.
There are no Level 4 counties in Alabama. There are three major cities in Alabama – Mobile (Mobile and Baldwin counties), Huntsville (Huntsville County) and Birmingham (Shelby and Jackson counties).