The overall average (and seat totals) for the parties in the polls ending between May 26th and 29th in the UK General Election were as follows :
| CONSERVATIVES | 45% | 360 seats |
| LABOUR | 35% | 218 seats |
| LIBERAL DEMOCRATS | 8% | 10 seats |
| UNITED KINGDOM INDEPENDENCE PARTY | 5% | |
| SCOTTISH NATIONALIST PARTY | 4% | 44 seats |
| PLAID CYMRU | 1% | |
| GREENS | 2% |
The Conservatives are up 7 points since 2015 and would gain 30 seats – however the first polls after the election was called suggested they would gain 125 seats. They would gain particularly amongst older voters (up 14% since 2015), working-class voters and voters in the North and Scotland. By contrast, their vote amongst younger voters has actually dropped slightly since 2015. They were gaining strongly amongst working-class voters, but it does seem that the traditional class cleavage is reasserting itself somewhat – that said the Tories are still 3 points ahead of Labour amongst working-class voters. The Tories would win 126 of the 159 most middle-class constituencies, compared to 24 of the 139 most working-class constituencies (up from 13 in 2015). They also win 194 of the 220 constituencies with the Oldest age profile (up from 176 in 2013), compared to 21 of the 122 constituencies with the youngest age profile. In fact in the 182 constituencies with the youngest age profile, they lose 32 seats compared to 2015, as against gaining 22 seats in the remaining (older) constituencies. Geographically, The Tories lose 6 seats collectively in London and the South and gain 35 seats in the North, Scotland, Wales and the Midlands.
Labour have held onto their younger vote – in fact they have significantly increased it (up 15% since 2015), but have remained largely static amongst middle-aged and older voters. They started off the campaign behind The Tories practically everywhere but now lead them in London and the North and indeed in Wales – which is a big improvement on the near-complete wipeout there suggested by previous polls.They are now significantly more popular amongst women than with men. Labour would win just 25 of the 159 most middle-class constituencies, compared to 108 of the 139 most working-class constituencies. They win only 14 of the 220 constituencies with the oldest age profile (down from 22 in 2015), compared to 92 of the 122 constituencies with the youngest age profile (up from 87 in 2015). Labour have gained during the campaign particularly from Female voters – The Tories led them nearly 2 to 1 at the start of the campaign, but now Labour are only a few points behind. Similarly they started the campaign nearly 20 points behind the Tories with working-class voters but are now virtually tied with them.
The Socio-economic profile of Tory and Labour voters is actually quite similar – 37% of Tory voters are working-class, compared to 43% of Labour voters – but the gap does seem to be widening. The real difference is the age-profile – Over half of Tory supporters are over 55, comparely to just over a quarter of Labour supporters, while only one sixth of Tory voters are under 35, while these younger voters account for 40% of Labour voters,
The Liberal Democrats have fallen three points since the start of the campaign, and so are back at their 2015 figure. Presently, they look like making two net gains, though the line between safety and disaster is thin. They fare markedly better amongst middle-class voters (nearly three-quarters of Liberal Democrat voters are middle-class), and the vast majority of Liberal Democrats are Remain voters, due partly to a small influx of Remain voters from other parties, but also because of an exodus of 2015 Liberal Democrat voters who voted LEAVE. There is a considerable flux in the Liberal Democrat voter base, with nearly half of their 2015 voters leaving for either the Tories or Labour, being replaced by other voters coming from those parties. This could possibly be a positive sign inasmuch as that this churn it could represent the movements of voters intending to vote tactically. 8 of the 10 Liberal Democrats would be in seats that are more middle-class than the National Average.
UKIP entered the campaign with just over half their 2015 vote and now have less than a third of it. The majority of 2015 UKIP voters now say they are going to vote Conservative (though a small minority are now switching to Labour as well). They do best amongst working-class voters, and the vast majority of UKIPers are Leave voters.
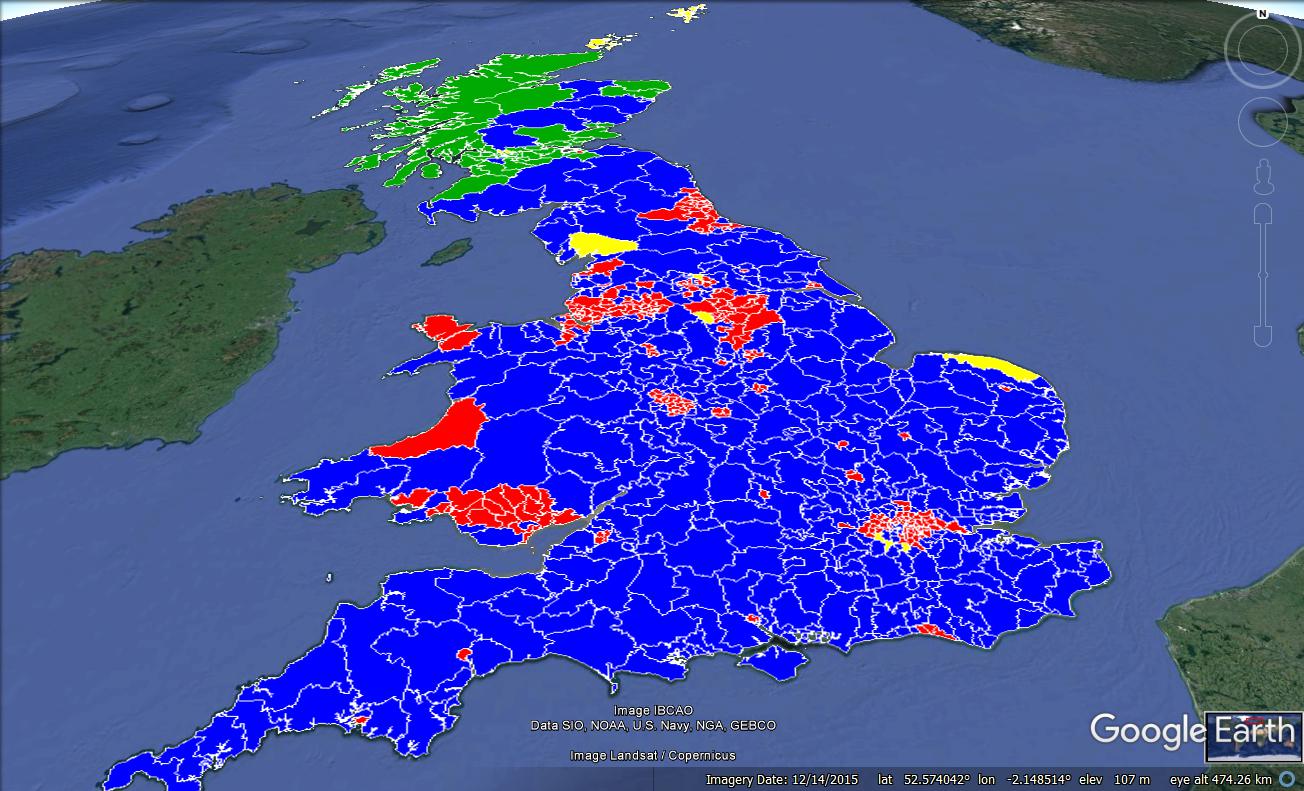
The SNP would still retain a majority of the seats in Scotland, even though their vote is down significantly and the Conservatives look set to take 11 (mainly rural) seats.
The Conservatives been hitherto very successful in retaining their 2015 voters, with 9 out of 10 consistently saying they are sticking with them, but that is now down to 6 out of every 7. In addition over half of 2015 UKIP voters and 1 in 6 2015 Liberal Democrat voters (and 1 in ten 2015 Labour voters) are now intending to vote for the Conservatives. Of Particular interest is that, despite the fact that the Conservatives are implementing Brexit, they are managing to hang on to more than 5 out of 6 of their 2015 voters who voted REMAIN in 2016 (source : ICM polls). This compares to the Liberal Democrats only retaining less than half of their Leave Voters.
At the time of the Brexit Referendum The Tories were virtually tied with UKIP amongst Leave voters – they started this campaign 50 points ahead of them, and have strengthened this lead reflecting polling showing that the bulk of 2015 UKIP voters are now intending to vote Conservative. By contrast, The Tories started the campaign again virtually tied with Labour amongst Remain Voters – but have now fallen significantly behind them amongst this cohort.
Download the report here : UK May 26 to May 29