The following is an analysis of the current bye-election in Dublin Bay South – looking at hard data such as transfer rates, historical voting trends and socio-economic voting patterns. Also I have a look at the interesting poll done by the Irish Times and MRBI.
TRANSFERS : Below are two tables, the first showing selected transfers from the General Election in 2020, the second showing the distribution of the Green Party surpluses in the three local electoral areas either wholly or partly within Dublin Bay South.
The first row below shows the transfer of the Green surplus of 969 votes after the 1st vount. The largest individual share went to Fine Gael who took just under 30%, followed by the Greens’ fellow centre-left parties Labour (24%) and the Social Democrats (19%). By contrast Sinn Féin and People Before Profit took only 10% combined.
The second row deals with the distribution of the small Renua vote. Just under a third went to Fianna Fáil, and a further near-third was non-transferable. Fine Gael took 14%, and the rest was divided between the other parties.
The third row deals with the distribution of the combined Social Democrat and People Before Profit vote – just under two-thirds of the amalgamated vote went to the SDs. 40% went to Labour and 32% to Sinn Féin – it’s not unreasonable to hypothesize that more of the PBP vote went to Sinn Féin while the Social Democrat vote favoured Labour.
Finally the Labour vote transferred heavily to Fine Gael, and Fianna Fáil took slightly more than Sinn Féin.
| SELECTED TERMINAL TRANSFERS IN GE20 IN DUBLIN BAY SOUTH | PARTY | FG | SF | FF | LAB | SD | LEFT | OTH | IND | NT |
| GP | 29% | 5% | 12% | 24% | 19% | 5% | 1% | 5% | — |
| REN | 14% | 7% | 31% | 9% | 6% | 5% | — | — | 30% |
| SOL/SD | 11% | 32% | 6% | 40% | — | — | — | — | 12% |
| LAB | 36% | 19% | 20% | — | — | — | — | — | 25% |
The table below shows the Green First count surpluses in Dublin Bay South’s three constituent local electoral areas – Pembroke, South-East Inner City and Kimmage-Rathmines (the eastern half of the area lies in DBS).
In both Kimmage-Rathmines and South-East Inner City, Labour and the Social Democrats took around half of the Green surplus, Fine Gael took around a sixth, Left candidates took around 10% while both Sinn Féin and Fianna Fáil were in single figures. However in Pembroke, Fine Gael took 36% to Labour’s 28% (there was no Social Democrats candidate) while the Left candidate took 15% compared to only 10% for Fianna Fáil and a paltry 2% for Sinn Féin.
| GREEN PARTY SURPLUSES IN LE19 | |||||||||
| AREA | FG | SF | FF | LAB | SD | LEFT | OTH | IND | |
| K-RMINES | 18% | 3% | 7% | 20% | 30% | 10% | — | 12% | |
| SEIC | 15% | 6% | 6% | 23% | 27 | 11% | 1% | 1% | |
| PBROKE | 36% | 2% | 10% | 28% | — | 15% | — | 7% | |
The main takeaway is that the Green Party is likely to transfer strongly fellow centre-left parties Labour and the Social Democrats, but that a significant minority of Green transfers may go to Fine Gael – both Fianna Fáil and Sinn Féin tend not to benefit from Green transfers. Social Democrat transfers will mainly stay on the left, but are likely to prefer centre-left parties over those further left, though Sinn Féin might attract a significant minority. People Before profits are likely to transfer strongly to Sinn Féin but the likely small number of votes in question means it is unlikely to be a significant factor.
DEMOGRAPHICS :
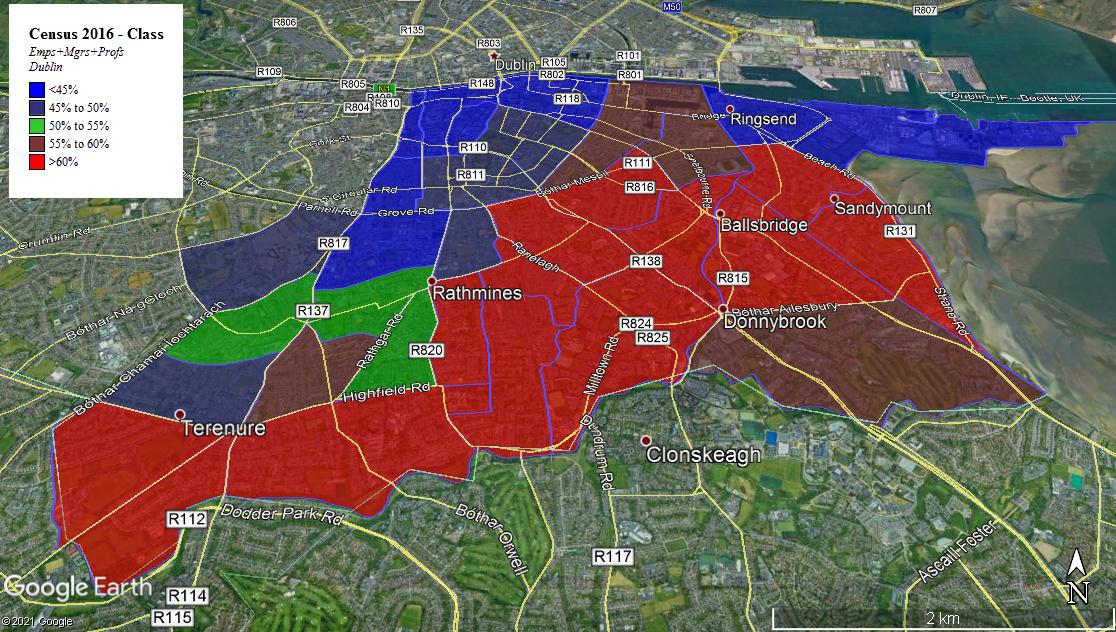
This section analyses Socio-Economic Voting patterns based on the proportion of households where the primary breadwinner is an Employer, Manager of Professional.
To allow a meaningful analysis, I’ve decided to divide the constituency into three cohorts for this analysis – firstly, DEDs where the percentage of “Middle-Class” households (as defined above) is less than 45%. Secondly, DEDs where the percentage of Middle-Class Households is between 45% and 60% – and finally DEDs where the percentage of Middle-Class Households is greater than 60%.
In those areas with less than 45% middle-class housing – essentially the more working-class areas in the north and north-west of the constituency, Fianna Fáil were well ahead of all other parties in 2002 and 2007 (in Dublin Sth-East). Labour were it seems the main beneficiaries of Fianna Fáil’s collapse in 2011, and Sinn Féin in turn were the main beneficiaries of Labour’s collapse in 2016. They further improved their position in 2020.
| MIDDLE-CLASS HOUSEHOLDS – LESS THAN 45% | ||||||||||
| FG | SF | FF | GP | LAB | SD | LEFT | PD | OTH | IND | |
| 2002 | 10% | 14% | 32% | 18% | 14% | — | — | 10% | — | 3% |
| 2007 | 12% | 9% | 31% | 16% | 19% | — | — | 6% | — | 6% |
| 2011 | 19% | 7% | 11% | 6% | 36% | — | 3% | — | — | 17% |
| 2016 | 14% | 25% | 10% | 8% | 11% | 7% | 9% | — | 7% | 8% |
| 2020 | 12% | 40% | 9% | 16% | 9% | 5% | 4% | — | 1% | 5% |
In those areas with between 45% and 60% middle-class housing, Fine Gael made big gains in 2011, largely inheriting the 16% the Progressive Democrats got in their last election in 2007. Labour also made gains but lost them in 2016 and have now been overtaken by Sinn Féin who made inroads to outpoll them by 2 to 1 last year.
| MIDDLE-CLASS HOUSEHOLDS – BETWEEN 45% AND 60% | ||||||||||
| FG | SF | FF | GP | LAB | SD | LEFT | PD | OTH | IND | |
| 2002 | 18% | 5% | 26% | 16% | 12% | — | — | 21% | — | 2% |
| 2007 | 21% | 3% | 28% | 13% | 15% | — | — | 16% | — | 3% |
| 2011 | 37% | 3% | 11% | 7% | 25% | — | 1% | — | — | 16% |
| 2016 | 28% | 10% | 12% | 12% | 12% | 7% | 5% | — | 10% | 5% |
| 2020 | 25% | 17% | 14% | 23% | 9% | 5% | 3% | — | 1% | 3% |
In those areas with between 60% middle-class housing – the wealthiest areas of the constituency stretching from Terenure in the south-west across to Ballsbridge, Donnybrook and Sandymount in the East – Fine Gael doubled their vote in 2011 to take nearly half the vote. Their vote has fallen back somewhat since but they are still well ahead of all other parties. The Green party doubled their vote in 2020 to take over a quarter of the vote in these areas. Sinn Féin have not been able to make the breakthrough in these areas that they have in other parts of the constituency.
| MIDDLE-CLASS HOUSEHOLDS – OVER THAN 60% | ||||||||||
| FG | SF | FF | GP | LAB | SD | LEFT | PD | OTH | IND | |
| 2002 | 21% | 3% | 22% | 15% | 11% | — | — | 26 | — | 1% |
| 2007 | 23% | 2% | 26% | 13% | 15% | — | — | 18% | — | 3% |
| 2011 | 46% | 2% | 12% | 7% | 18% | — | 1% | — | — | 15% |
| 2016 | 39% | 3% | 12% | 13% | 10% | 6% | 2% | — | 13% | 3% |
| 2020 | 37% | 6% | 16% | 26% | 7% | 4% | 2% | — | 2% | 2% |
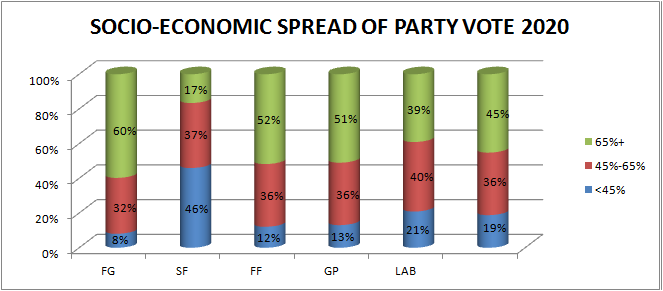
The graphs below shows the composition of each of the major parties’ vote base first in 2002 and then in 2020. It should be noted that the social composition of the constituency has changed markedly in between the 2006 and 2016 censuses, partly due to increasing gentrification in the inner city and canal area but also increasing proportion of middle-class households in the more settled parts of the constituency – there were increases of over 10% in south Rathmines for instance.
In 2002, 20% of the vote was cast in District Electoral Divisions which are over 60% Middle-class – by 2020, 45% of the votes were cast in DEDs over 60% middle-class.
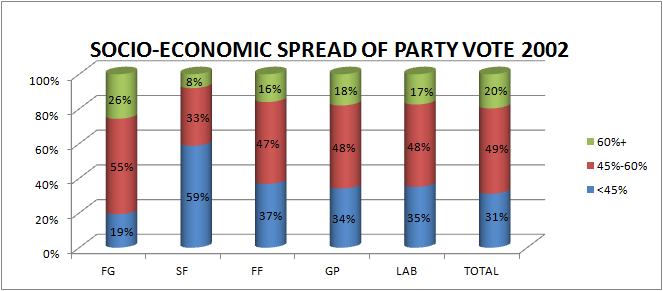
It’s interesting to note – even accounting for the increase in middle-class households – the change of the nature of the Fianna Fáil vote between 2002 and 2020. The Fianna Fáil vote in 2002 was more based in working-class areas than the constituency average – in 2020 the opposite was true. The Green Party also has a more middle-class vote profile (again accounting for changes) than it did in 2002.
The Sinn Féin vote is very disproportionately working-class, but even so more than half their vote now comes from the more middle-class parts of the constituency.
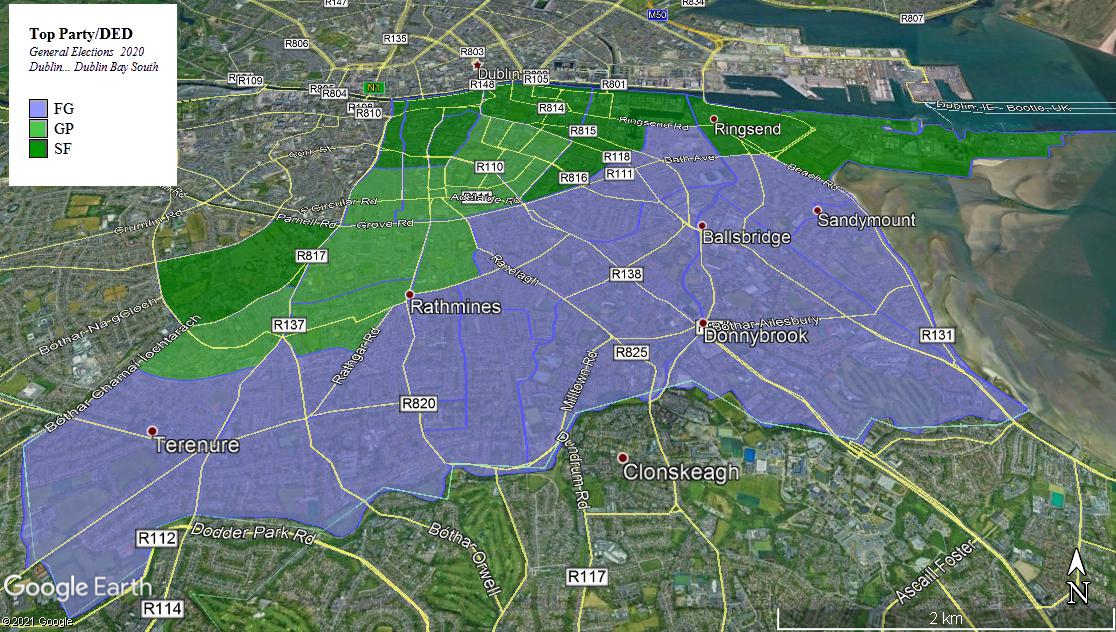
GEOGRAPHY :
The first four maps here are those of the main parties in the 2020 General Election – Fine Gael, the Greens, Sinn Féin and Fianna Fáil.
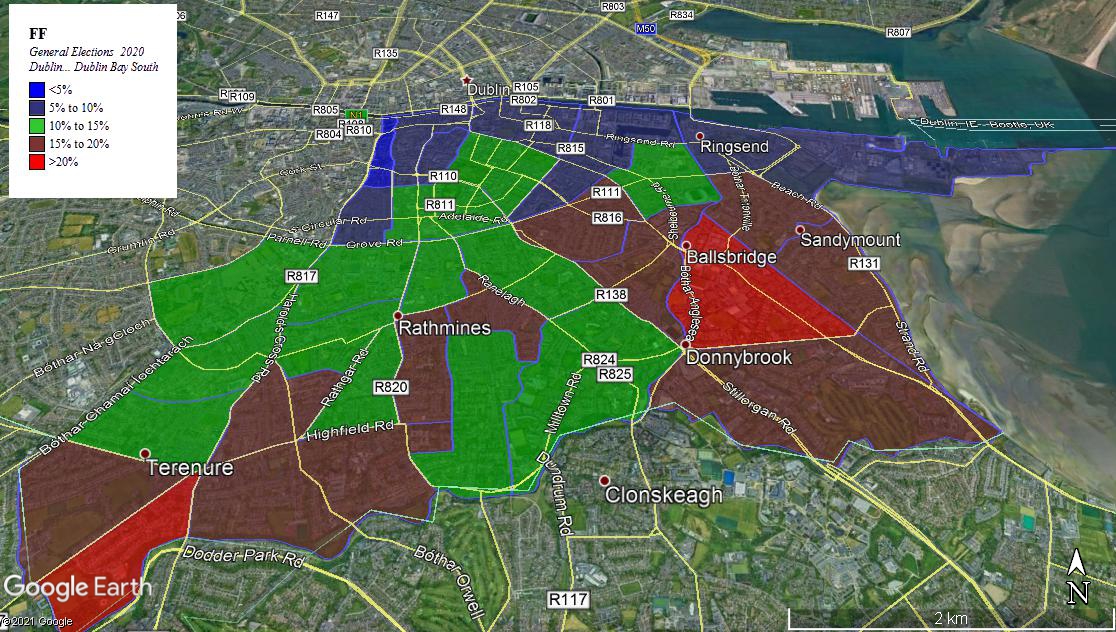
Interestingly the Fianna Fáil vote peaks in two geographically distinct areas – in Terenure D (mainly Rathdown Park, in between the Templeogue Road and the Dodder) and Pembroke East E (bounded by Anglesea, Ailesbury and Merrion Road). In 2002, the Fianna Fáil vote was strongest in the north of the constituency but that pattern has been reversed.
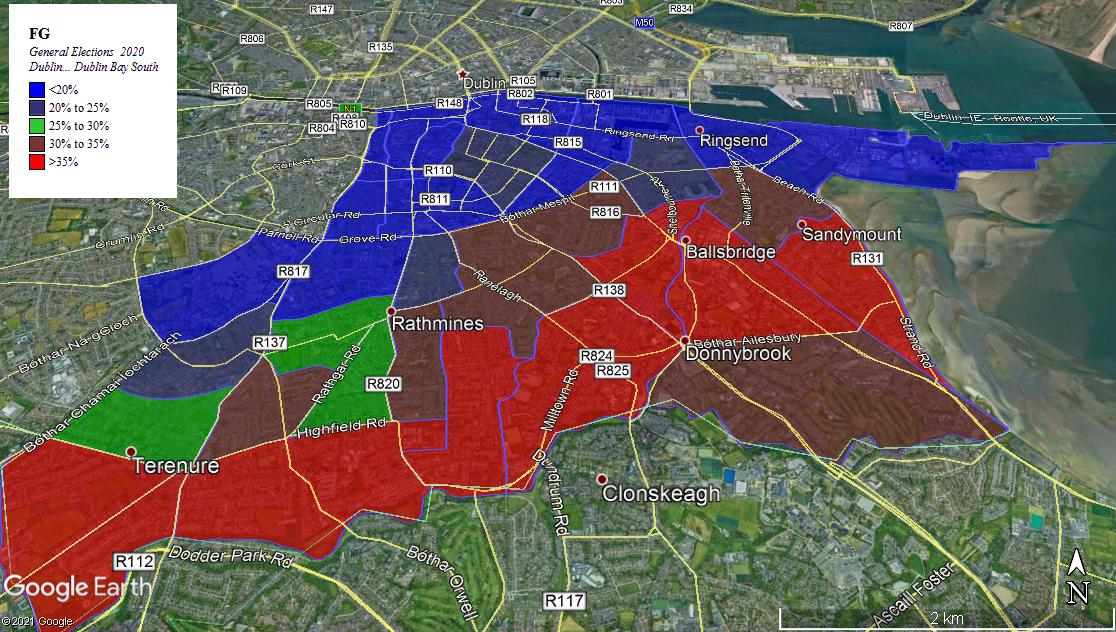
The further South you go in Dublin Bay South, the stronger the Fine Gael vote gets. They took 35%+ in a band of areas stretching from Terenure in the South-West to Sandymount in the East.
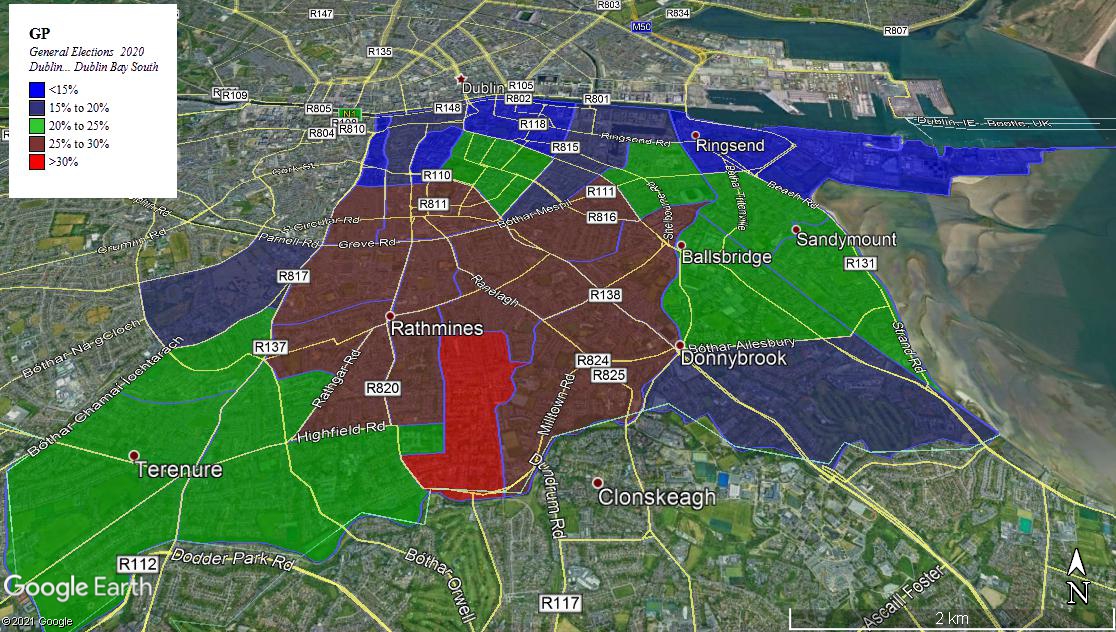
The Green Party vote was strongest – over a quarter of the vote – in the vicinity of Rathmines and Ranelagh stretching over the canal into Portobello.
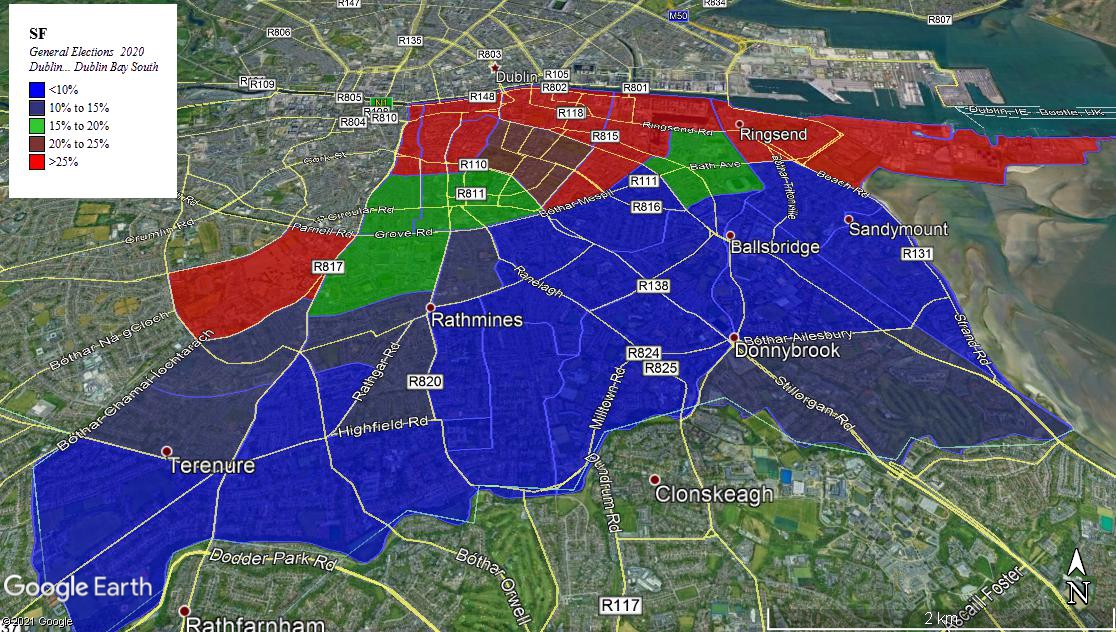
The Sinn Féin vote was strongest in the between the canal and The Liffey, in Ringsend and also in Harold’s Cross.
Below – because I clearly have too much time on my hands – I’m going to compare the Candidate and Party Poll-topper maps from 2002 with 2020.
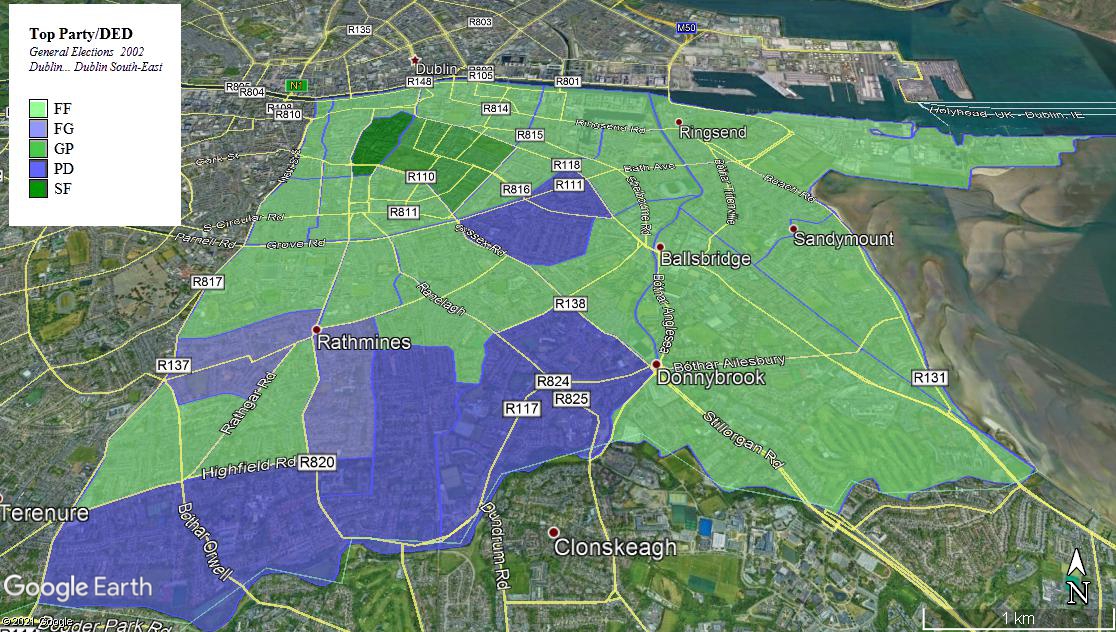
It’s interesting to note that Fianna Fáil was the biggest party in many of the working-class areas in the North of the constituency while also coming first the very well-appointed environs of Donnybrook, Ballsbridge and Sandymount (though that was probably mainly due to the “Blue” vote being divided between Fine Gael and the Progressive Democrats). Sinn Féin and The Greens topped the poll in neighbouring DEDs – the Greens in Mansion House B (Dawson Street, Nassau Street, Kildare Street across to Merrion Square) and Sinn Féin in Royal Exchange B (South William Street and neighbouring areas down to York Street and Cuffe Street).
Fast forward to 2020 and all is changed, changed utterly. The map is dominated by Fine Gael, the Green Party and Sinn Féin. Fianna Fáil have disappeared from the map and the Progressive Democrats have disappeared completely.
I thought it would be interesting – again, I’m clearly underutilised – to contrast and compare the results in Mansion House B and Royal Exchange B in 2002 and 2020.
| Area/Year | FG | SF | FF | GP | LAB | PD | OTH | IND | |
| Mansion House B 2002 | 11% | 5% | 21% | 25% | 16% | 17% | — | 2% | Mansion House B 2020 | 25% | 20% | 12% | 24% | 7% | — | 10% | 1% | Royal Exchange B 2002 | 5% | 34% | 30% | 15% | 16% | 1% | — | 1% | Royal Exchange B 2020 | 3% | 60% | 6% | 6% | 3% | — | 12% | 10% |
There were sizeable movements in both DEDs, but especially in Royal Exchange B – in both 2002 and 2020 Fianna Fáil and Sinn Féin took nearly two-thirds of the vote between then; but whereas in 2002 the spoils were shared nearly equally, in 2020 Sinn Féin outpolled Fianna Fáil by 10 to 1. Sinn Féin’s dominance is underscored by the fact that no other party took more than 10% of the vote.
In Mansion House B, the Green vote is remarkably similar but otherwise it is all change. Both Fine Gael and Sinn Féin see their vote rise by about 15% – Fine Gael presumably largely from the old PD vote, and Sinn Féin perhaps more so from Fianna Fáil and Labour.
Below are the poll-toppers in 2002 and 2020.
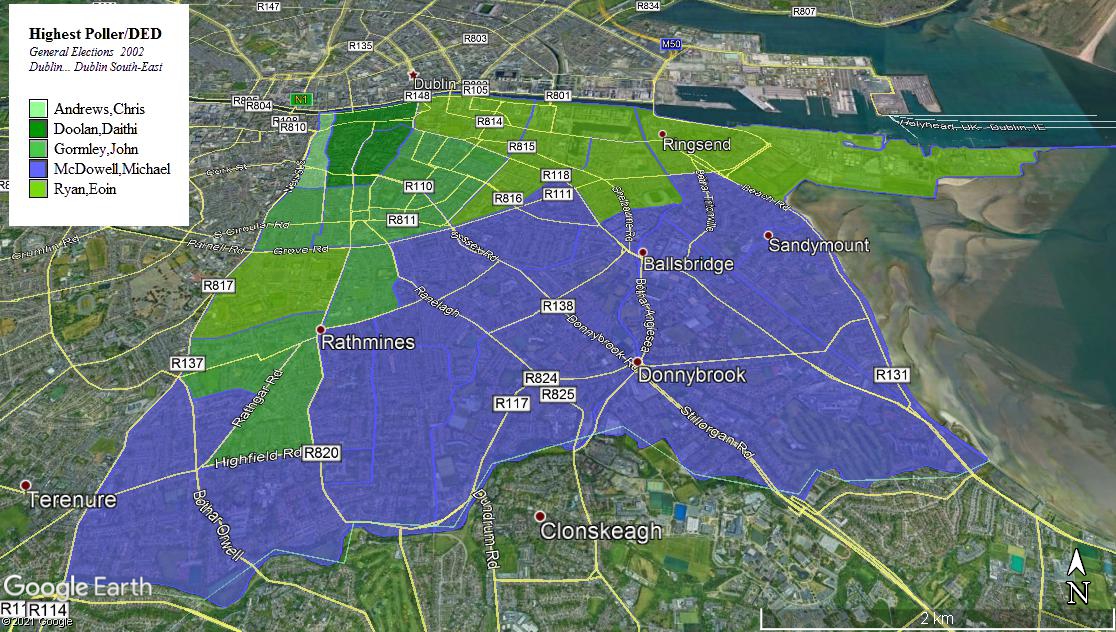
Michael McDowell dominated the entire south of the constituency – in fact the areas he tops the poll in are very similar to the areas Fine Gael came top in 2020 in. Both Fianna Fáil candidates topped the poll in different areas.
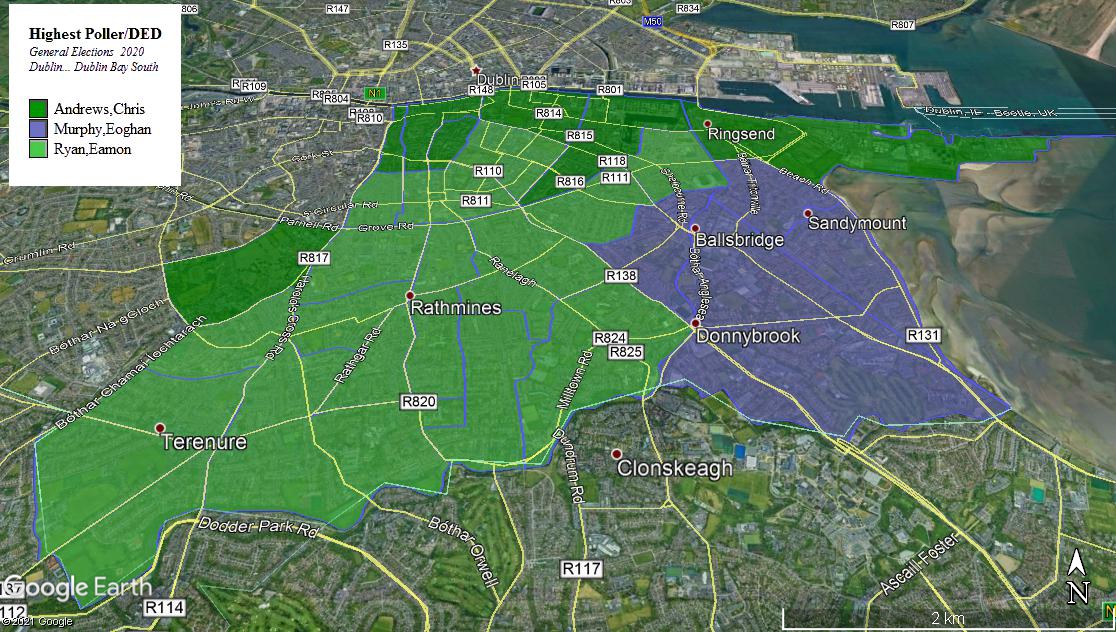
In 2020 there were only three poll-toppers – Eoghan Murphy in Ballsbridge, Donnybrook and Sandymount, Chris Andrews across the north of the constituency and Eamon Ryan in Terenure, Rathmines, Ranelagh and Portobello.
PROJECTION AND POLLS:
The Irish Times/MRBI did an interesting Dublin Bay South constituency poll recently, measuring both people’s voting intention in the Bye-Election as well how they might vote in a General Election. The most obvious disparities were that at 27%, James Geoghegan is fully 10% below what Fine Gael would achieve in a General Election while at 22% Ivana Bacik is 12% above Labour’s General Election rating. Comparing against the 2020 General Election however, it’s not unreasonable to assume that a good deal of Bacik’s extra support comes from Green voters – who may have been previously Fine Gael voters (I noted above that the Green’s voter profile seems to have got more middle-class over the years).
Finally my latest Tallyriffic Dublin Bay South projection actually closely with the MRBI General Election voting intention – the only outliers being the Sinn Fein (20% vs 15%) and the Labour (5% vs 10%) figures.
| VOTING INTENTIONS | |||||||||||
| Measure | FG | SF | FF | GP | LAB | SD | LEFT | AON | OTH | IND | |
| GE20 | 27.7% | 16.1% | 13.8% | 22.4% | 7.9% | 4.5% | 2.5% | — | 2.2% | 2.7% | |
| MRBI – BE | 27% | 13% | 10% | 11% | 22% | 5% | 2% | 3% | 1% | 6% | |
| MRBI – GE | 37% | 15% | 13 | 13% | 10% | 4% | 2% | 1% | — | 4% | |
| Tallyriffic | 37% | 20% | 11% | 15% | 5% | 4% | 2% | — | 2% | 3% | |
If we were to take the MRBI figures and transform them into votes at a 25% turnout rate (similar to Dublin Mid-West and Dublin Fingal in 2019) you would have Geoghegan starting at just over 5,000 votes with Bacik just over 1,000 behind. There would probably be little movement in either relative or absolute terms until probably the 10th count when the elimination of Durcan of the Social Democrats would slightly narrow the gap between Geoghegan and Bacik, with significant proportions also going to Sinn Féin and the Greens. Mannix Flynn’s votes on the next count would be likely to scatter broadly. Next to be eliminated would be Deirdre Conroy of Fianna Fáil and you would expect her votes to perhaps slightly extend Geoghegan’s lead though not by a significant margin. The first crucial transfer is that of the Green vote – given the seeming exodus of their more left-leaning support since the party entered government, it might be expected that the party’s transfers (which hitherto didn’t have a decided preference for either Fine Gael or Labour) might now slant towards Fine Gael – however Clare Byrne has apparently called for Green transfers to go to Labour. The only thing certain is that Sinn Féin will not get many of them. I would be inclined towards the view that Green transfers will again somewhat narrow the gap between Geoghegan and Bacik but not eliminate it. The known unknown therefore is Boylan’s transfer – we can say with certainty that Fine Gael will get very few of those votes, but how many will transfer to Labour and how many won’t transfer at all? If we were to see 10% go to Geoghegan, 60% to Bacik and 30% non-transferable, you would see Bacik taking the seat by just over a thousand votes.
The one caveat I would make is that while I would find myself largely concurring with the results of the poll, I would have reversed the positions of Bacik and Boylan. It may well be that Bacik’s campaign has picked up momentum, but there is a possibility of wide variations in turnout on the day, it’s quite possible that Boylan’s could be under-estimated as a strong Get-Out-The-Vote effort in Sinn Féin’s working-class strongholds could boost their vote by several points in a generally low-turnout environment. That said – Boylan would need to be several points ahead of Bacik to ensure making it to the last count so on this poll she would seem to have a hill to climb. Geoghegan would certainly prefer to face Boylan on the last count rather than Bacik.