Preamble
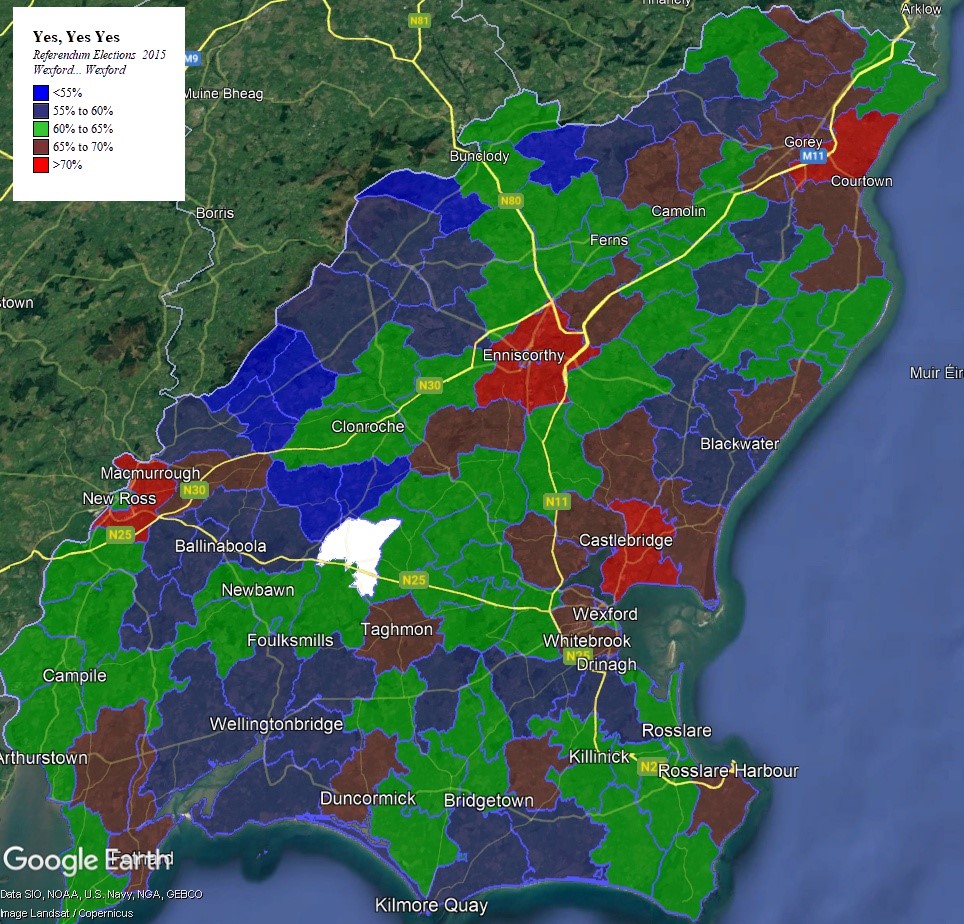
The Overall Yes vote in the Marriage Vote in Wexford was 63.6% – some 1.5%
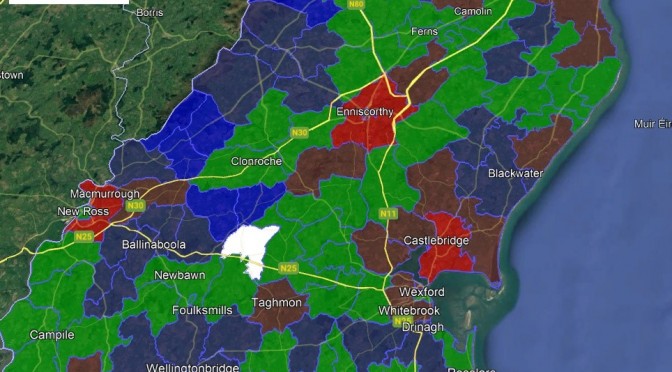
Below is the general map of the vote with the highest Yes votes being cast in around the four larger towns.
MAP 1 – YES VOTE IN COUNTY WEXFORD
The Highest and Lowest Yes Votes
Below I’ve listed the six polling stations where, according to the tallies, the Yes exceeded vote exceeded 70%.
71% – Ballyduff, Gorey Central, Enniscorthy (St. Aidans)
72% – Castlebridge
73% – Ballymurn
76% – Riverchapel
The first thing to note is that none are in the broad south of the county – including Wexford town. However two are located just north of Wexford, including Castlebridge which is a rapidly expanding village favoured by younger Dublin-bound commuters.
In fact all six of the polling stations are located quite close to the route of the N11. Riverchapel is the polling station for Courtown, while Ballymurn lies in the Kilmallock DED, with a lower Yes vote in Camolin to the south lowering the overal Yes vote in the DED.
MAP 2 – LOCATION OF HIGHEST AND LOWEST YES VOTES
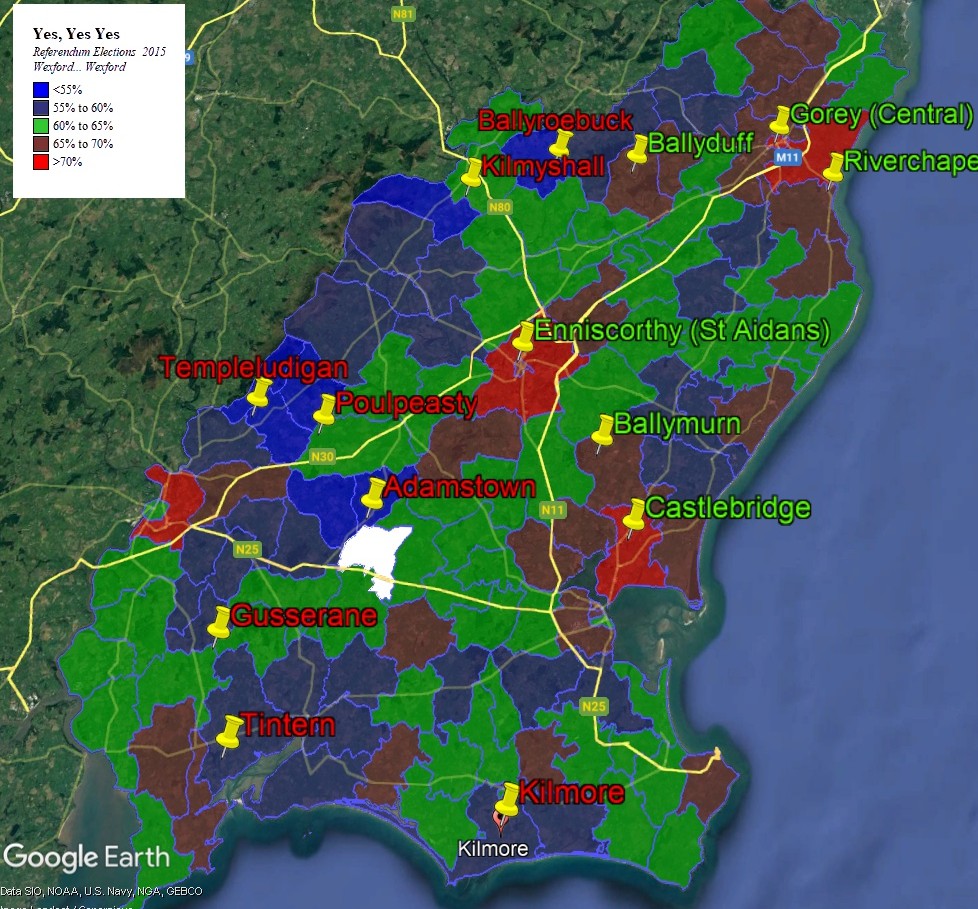
These are the eight polling stations where, according to the tallies, the Yes exceeded vote fell below 55%.
55% – Tintern, Templeudigan, Kilmore
54% – Ballyroebuck, Kilmyshall
53% – Poulpeasty
52% – Adamstown, Gusserane
The immediate thing to notice is that these are all small rural polling stations mainly clustered in the West of the county, and all are further away from the N11 than the sixth highest polling stations.
Five or six of the Polling stations lie along a long streak of terrirory stretching along the west of the county where the Yes vote stayed below 60%.
It should be noted that Gusserane lies at the intersection of several DEDs so therefore has only a limited effect on the result of any one DED.
Vote By Settlement Type
Lastly the following table shows the results by Settlement types.
TABLE 1 – VOTE BY SETTLEMENT TYPE
| AREA TYPE | NO VOTE | YES VOTE | % OF TOTAL | ||
| Vote | % | Vote | % | ||
| Large Town | 3,328 | 33% | 6,610 | 67% | 21% |
| Medium Town | 1,628 | 30% | 3,705 | 70% | 12% |
| Small Town | 800 | 31% | 1,804 | 69% | 6% |
| Villages | 1,728 | 37% | 2,922 | 63% | 10% |
| Hamlets | 3,155 | 39% | 4,920 | 61% | 17% |
| Rural | 10,061 | 39% | 16,405 | 61% | 34% |
Essentially in towns (settlements with greater than 2,000 population), the Yes Vote was 68%, while in Villages and Rural areas it was 61%.
It is interesting to note that the highest votes tended to be just outside the major towns rather than in them – for instance Castlebridge voted 72% Yes, but 3 of the 5 polling stations in Wexford town recorded Yes votes of less than 65%.
Similarly in Enniscorthy, the Yes in Enniscorthy Urban (67%) was lower than in Enniscorthy Rural (70%). And in New Ross Rural the Yes Vote (76%) was a full thirteen points ahead of that in New Ross Urban (63%). The reason for that is probably because with the expansion of towns across their traditional Urban boundaries, the newer residents tend to be younger than their peers in the older parts of the town. They are also more likely to have middle-class socio-economic occupations which could also be a factor.
Conclusion
The Yes Vote seems to have been informed by Geographic and Social factors, which themselves are somewhat intertwined. The six highest Yes Vote Polling Stations are located along the N11 Corridor, while the eight highest No Vote Polling Stations are located further away in the rural west and south of the county. Also higher Yes votes tended to be found in areas adjacent to large and medium sized-towns rather than in the towns themselves