Carol Nolan was first elected to the Birr Electoral Area of Offaly County Council in 2014, taking just over 10% of the vote and being elected on the 5th count (with Fine Gael transfers). She also took a quarter of John Leahy’s first count surplus – Leahy outpolled her by more than 2 to 1 in this contest, but she was to best him in both the 2016 and 2020 General Elections.
The 2016 General Election
The 2020 General Election
Changes between 2016 and 2020
Conclusion
First we’ll have a look at the 2016 General Election.
2016
Nolan took only 11% of the vote in the 3-seat Offaly constituency in 2019 – less than half a quota. However, she was fourth on the first count just a few hundred votes behind Tipperary-based Independent Joe Hannigan who proved friendless in the transfer market.
The lack of balance in the Fianna Fáil vote also meant that Nolan started nearly fifteen hundred votes ahead of East-Offaly based Eddie Fitzpatrick – that margin was cut to just under six hundred by the distribution of Barry Cowen’s surplus. The elimination on the third count of fellow East Offaly councillor John Foley brought FitzPatrick within 148 votes of Nolan – though he escaped elimination himself as he had been only 42 votes ahead of Foley.
TABLE 1 – TRANSFER ANALYSIS
| CNT | TRANSFER | NOLAN (SF) | FITZPATRICK (FF) | ||
| 1 | 4804 | 3394 | |||
| 2 | Cowen (FF) | 78 (6%) | 4882 | 903 (66%) | 4297 |
| 3 | GP + 3 INDs | 577 (21%) | 5459 | 281 (10%) | 4578 |
| 4 | Foley IND) | 836 (18%) | 6295 | 1569 (35%) | 6147 |
| 5 | Hann. (IND) | 900 (15%) | 7195 | 994 (17%) | 7141 |
| 6 | Leahy (REN) | 1590 (24%) | 8785 | 1380 (21%) | 8521 |
| 7 | C-Ken (FG) | 105 (35%) | 8890 | 199 (65%) | 8720 |
The elimination of Hannigan on the 4th count saw the gap narrow further to only 54 votes – which was a bit surprising given that Nolan was a lot closer to Hannigan’s Lower Ormond base – it seems a sizeable proportion of Hannigan’s supporters were more comfortable transferring to a Fianna Fáil candidate than a Sinn Féin one.
The elimination of Renua candidate John Leahy – previously a high profile Independent in North-West Offaly – slightly favoured Nolan, but not as much as you might expect based on their geographic proximity.
Going into the last count, Nolan was 264 votes ahead with 304 votes of a surplus from Marcella Corcoran-Kennedy of Fine Gael to be distributed – Fitzpatrick took nearly two-thirds of the transfers but it wasn’t enough and Nolan took the last seat by 170 votes.
MAP 1 – NOLAN SHARE OF THE VOTE IN OFFALY IN 2016
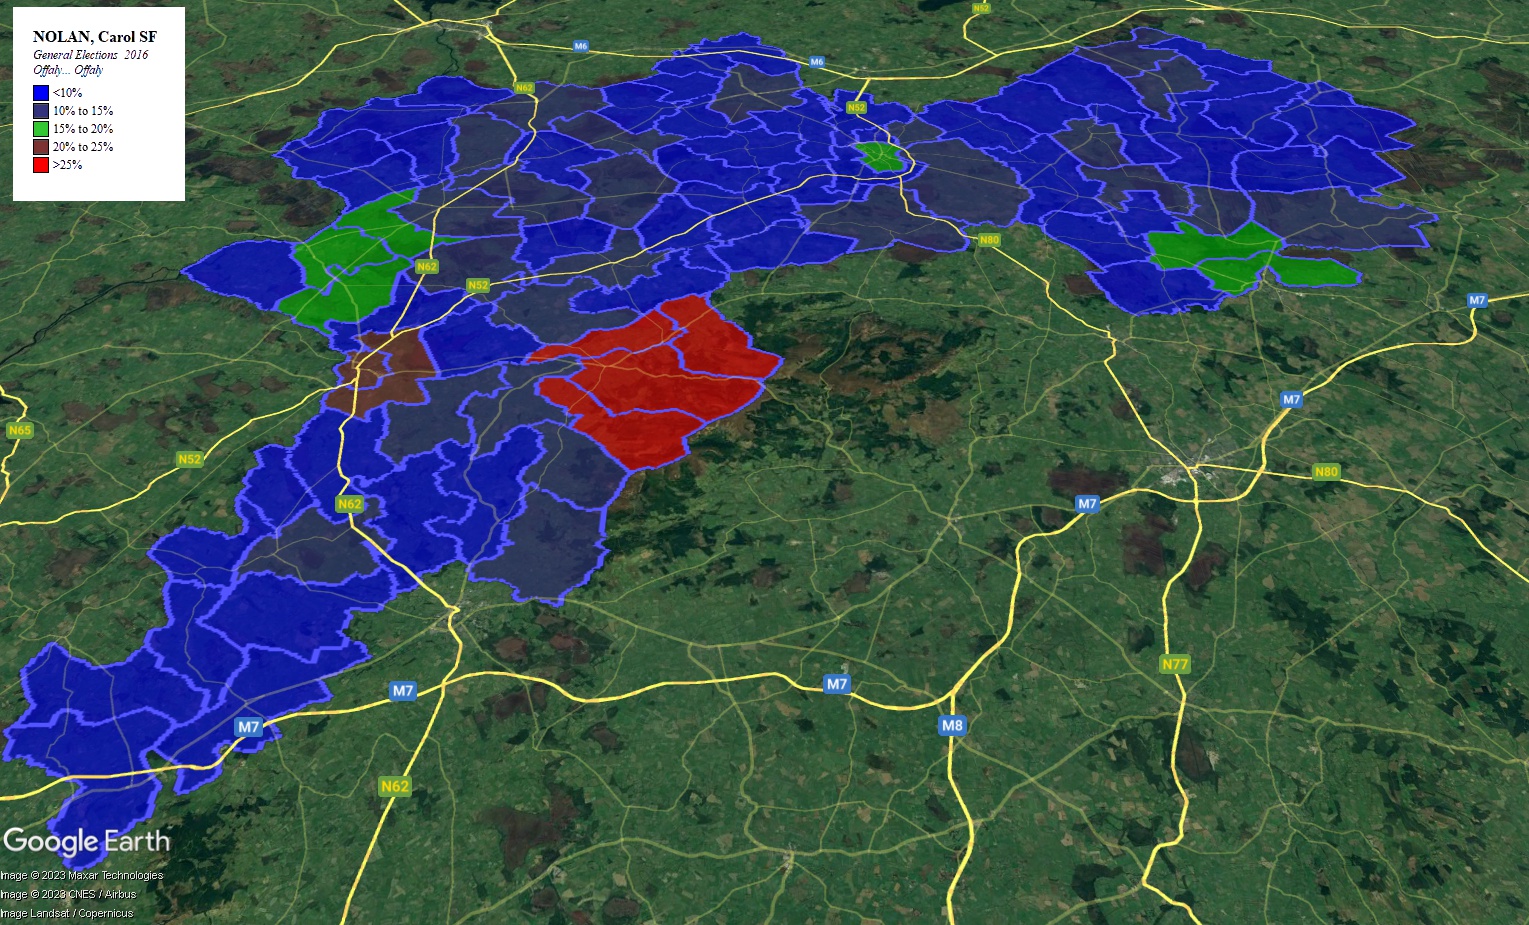
Nolan generally polled better in the towns than in rural areas, with strong polls in the towns of Birr, Portarlington (the part in Offaly) and Tullamore. She also polled well in the villages of Kinnity and Banagher.
TABLE 2 – CANDIDATE SUPPORT BY SETTLEMENT TYPE
| CANDIDATE | C-Ken | Cowen | F’Patrick | Foley | Leahy | Nolan |
| PARTY | FG | FF | FF | IND | REN | SF |
| LT+MT | 12% | 26% | 11% | 24% | 5% | 14% |
| ST+V | 15% | 38% | 3% | 6% | 16% | 13% |
| H+R | 18% | 32% | 11% | 7% | 14% | 10% |
The above table splits the tallied votes into three cohorts – those in large towns and medium towns (ie population of over 5,000), those in small towns and Villages (populations 500 to 5000), and those in Hamlets and Rural areas (population less than 500).
Carol Nolan (SF) polled better in Urban areas – by contrast Marcella Corcoran-Kennedy (FG) did notably better in rural areas. Barry Cowen did best in Small towns and villages – the inclusion of his home town Clara (where he took two-thirds of the vote) significantly influenced that figure.
Overall Nolan took 31% of her vote from larger towns and 35% of her vote from the rural areas.
TABLE 3 – TOP POLLING STATIONS FOR NOLAN IN 2016
| CANDIDATE | C-Ken | Cowen | FitzPatrick | Leahy | Nolan |
| PARTY | FG | FF | FF | REN | SF |
| Kinnity CC | 15% | 22% | 2% | 26% | 30% |
| Birr NS | 16% | 30% | 3% | 10% | 27% |
| Birr Oxmanstown | 17% | 30% | 3% | 10% | 26% |
| Tullamore Convent Rd | 14% | 38% | 3% | 6% | 21% |
| Birr OEC | 25% | 28% | 2% | 9% | 20% |
| Crinkle NS | 15% | 31% | 3% | 13% | 19% |
| Banagher | 16% | 32% | 2% | 24% | 18% |
| Tullamore Kilcruttin | 19% | 39% | 3% | 7% | 17% |
| Tullamore Arden | 16% | 42% | 3% | 9% | 16% |
| Portarlington GNS | 10% | 9% | 57% | 1% | 16% |
Six of Nolan’s top eleven performing boxes were based in larger towns (Tullamore, Portarlington, and Birr). In almost of these boxes she was in direct competition with Barry Cowen (FF) and Marcella Corcoran-Kennedy (FG).
2020
Nolan only slightly improved her vote in Offaly in 2020 by taking 12% – in addition she took 3% of the Laois vote, which saw her take 8% of the first-preference vote in the revived Laois-Offaly constituency.
TABLE 4 – TRANSFER ANALYSIS
| COUNT | TRANSFER | NOLAN (IND) | HACKETT (GP) | ||
| 1 | 5436 | 3494 | |||
| 2 | Stanley (SF) | 746 (15%) | 6182 | 427 (8%) | 3921 |
| 3 | REN + NP | 180 (20%) | 6362 | 70 (8%) | 3991 |
| 4 | Flanagan (FF) | 72 (4%) | 6434 | 90 (5%) | 4081 |
| 5 | Tynan (S-P) | 372 (16%) | 6806 | 484 (21%) | 4565 |
| 6 | Tuohy (LAB) | 303 (9%) | 7109 | 678 (21%) | 5243 |
| 7 | Smollen (IDP) | 1244 (31%) | 8253 | 568 (14%) | 5811 |
| 8 | Ormond (FF) | 495 (11%) | 8848 | 130 (3%) | 5941 |
| 9 | Cowen (FF) | 79 (13%) | 8927 | 23 (4%) | 5964 |
| 10 | C-Ken (FG) | 437 (8%) | 9364 | 504 (10%) | 6468 |
| 11 | Leahy (IND) | 3157 (56%) | 12521 | 641 (11%) | 7109 |
Although her vote only increased by just over 600 votes on 2016, she proved much more transfer-friendly and in fact overtook Séan Fleming (FF) to take the fourth seat on the final count by a margin of of over 5,400 votes from the Green Party’s Pippa Hackett.
On the second count, she took nearly a sixth of former colleague Brian Stanley’s transfers – second only to Stephen Tynan of People before Profit. The next count, she took the largest portion of transfers from the Renua and National Party candidates.
On the fifth count, she took a sixth of the transfers after Tynan’s elimination, although in this case Hackett actually slightly closed the gap, as she did again on the next count with the elimination of the Labour candidate.
She took a hefty third of IDP candidate Ken Smollen’s vote on the 7th count – Smollen was a founder of the IDP (Irish Democratic Party) which was a splinter party from Direct Democracy Ireland; ironically, DDI failed to win a single seat in the 2014 local elections, while Smollen won a seat for the IDP in Tullamore.
Finally on the last count, she took a massive 56% of John Leahy’s transfer – almost 3,200 votes. This compares to the 24% share she got in 2016. There were probably three factors involved in the magnitude of this transfer.
Firstly their geographical proximity; Leahy’s home-base in Kilcormac is only 6 miles from Nolan’s base in Kinnity – this factor was obviously also present in 2016.
Secondly, in 2020 they were both independents, whereas four years they had been representing ideologically dissimilar parties (Sinn Féin and Renua).
Thirdly, they both were identified with taking strong stances against the Repeal Referendum in 2018.
MAP 2 – NOLAN SHARE OF THE VOTE IN OFFALY IN 2020
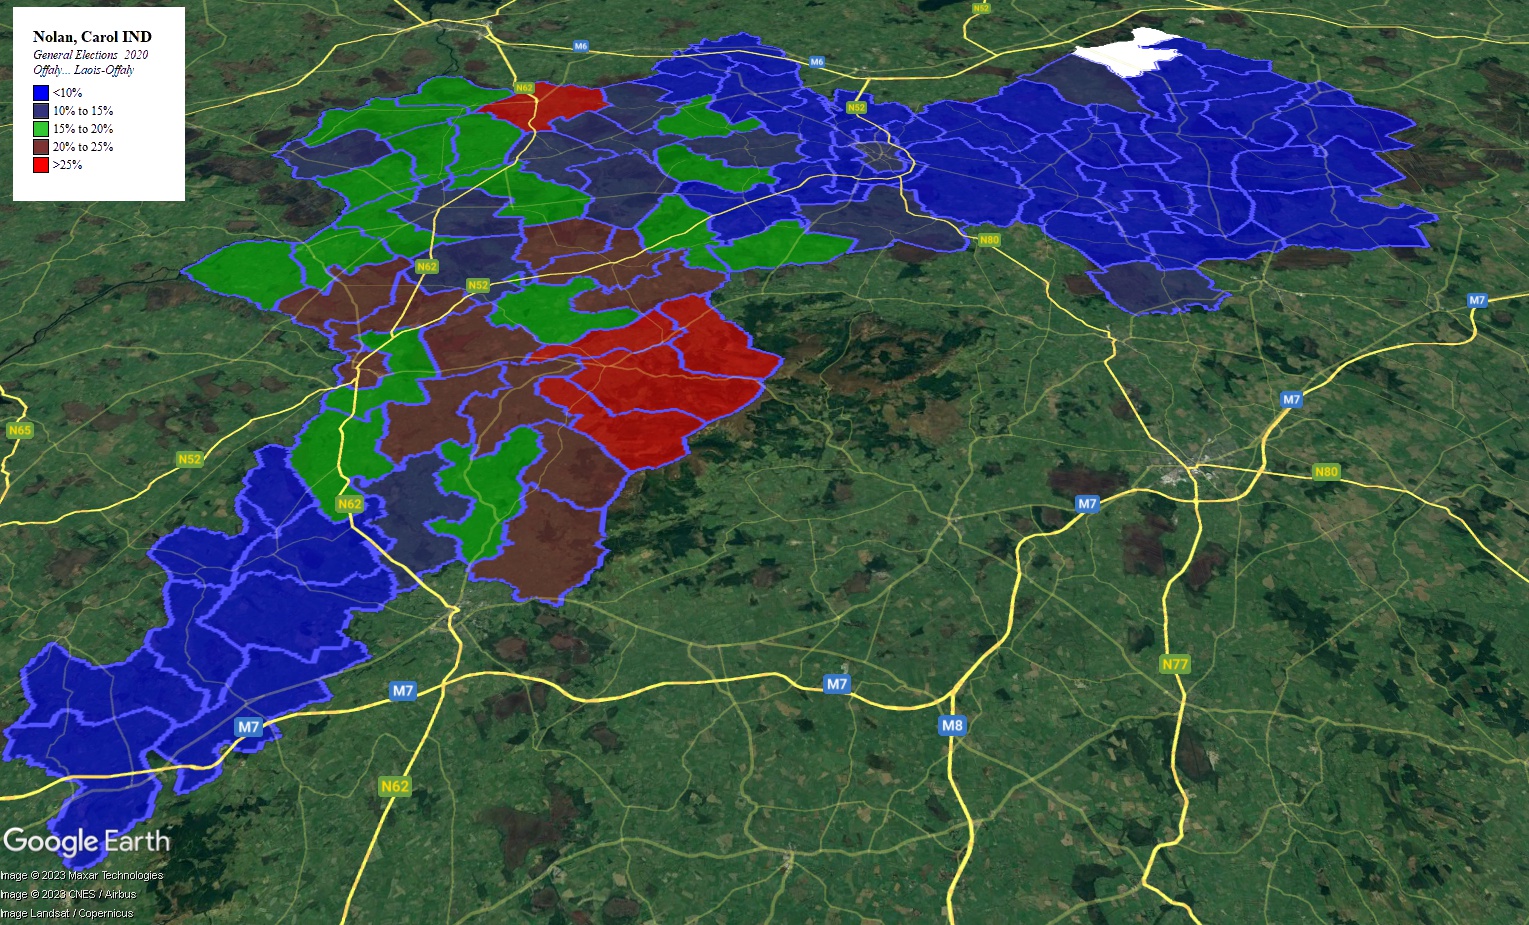
As can be seen, Nolan’s vote was notably accentuated in West and North-West Offaly – although she did manage to take a decent vote out of Tullamore (albeit down on her 2016 take as a Sinn Féin candidate).
TABLE 2 – CANDIDATE SUPPORT BY SETTLEMENT TYPE
| CAND. | C-Ken | Cowen | Leahy | Nolan | Ormond | Stanley |
| PARTY | FG | FF | IND | IND | FF | SF |
| LT+MT | 10% -2 | 26% | 4% -1 | 8% -6 | 3% | 24% +10 |
| ST+V | 10% -5 | 21% -17 | 12% -4 | 14% -1 | 14% | 18% +5 |
| H+R | 11% -7 | 21% -11 | 11% -3 | 13% +3 | 14% | 14% +4 |
The first thing to note is that Nolan’s vote fell significantly in the larger Urban areas, but actually increased in rural areas. In settlements of over 5,000 population, Brian Stanley of Sinn Féin outpolled her 3 to 1, yet in rural areas very little seperated them.
In 2016, nearly a third of her vote came from larger Urban areas – that fell to just one-sixth in 2020. By contrast nearly half her vote came from rural areas.
It’s also worth noting that Marcella Corcoran-Kennedy’s fell disproportionately more in rural areas.
MAP 3 – THE INDEPENDENT VOTE IN OFFALY IN 2020
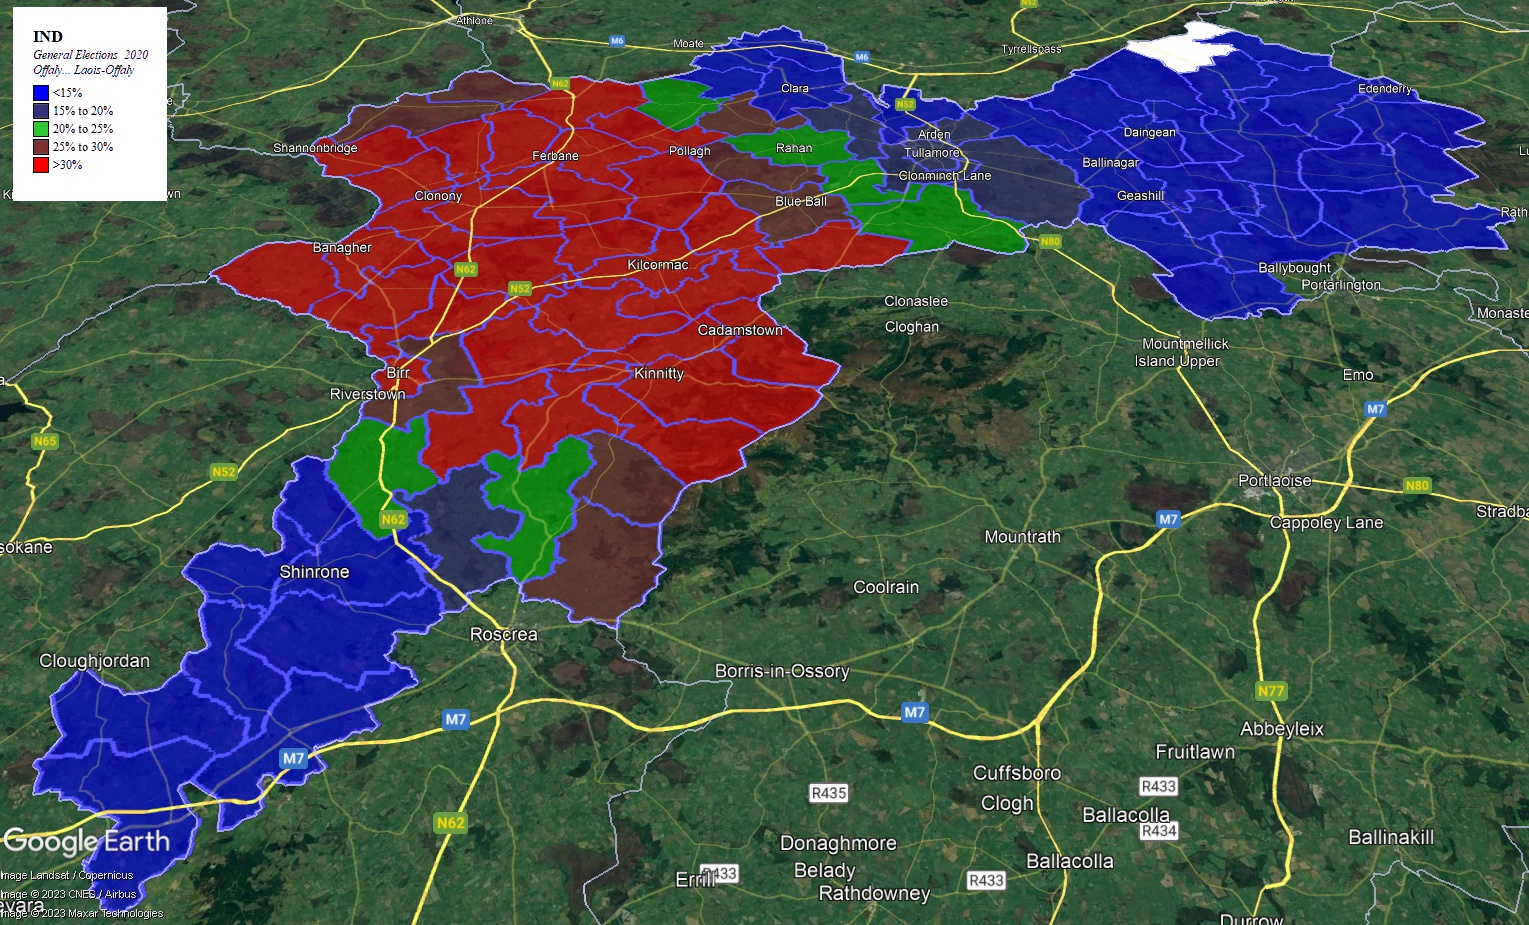
Leahy and Nolan were the only Independent candidates in Laois-Offaly in 2020 – as can be seen in the above map, their combined vote was maximised in the Old Ferbane area and the north of the Old Birr area.
MAP 4 – NOLAN SHARE OF THE INDEPENDENT VOTE IN OFFALY IN 2020
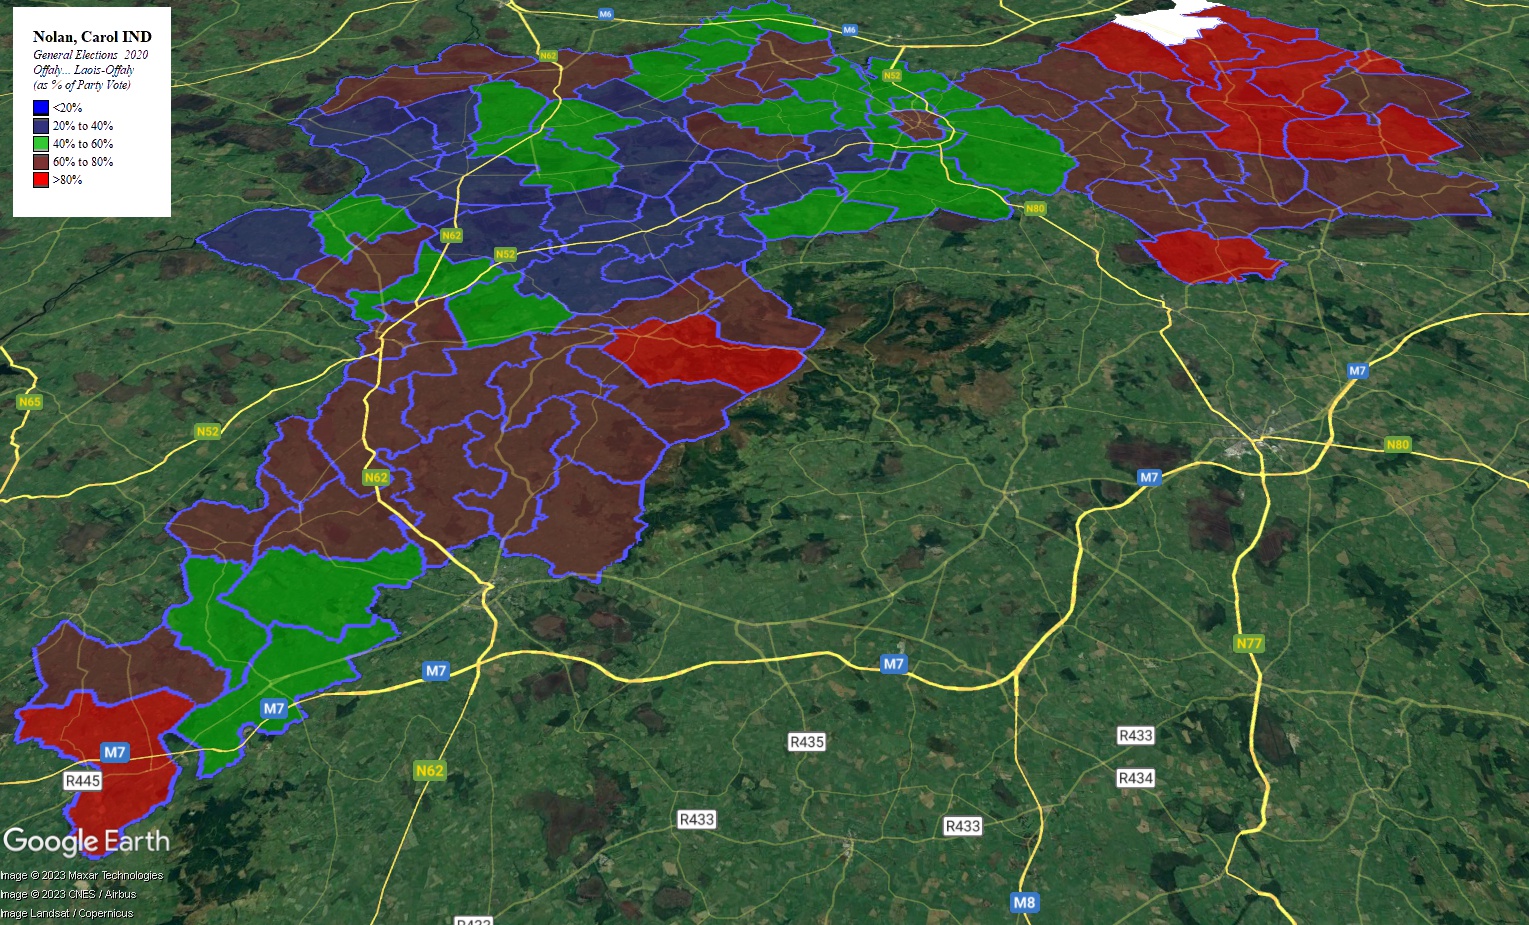
The above map shows that Nolan dominated the Independent Vote in the South and East of Offaly, while Leahy was probably ahead in the old Ferbane area in the North-West.
MAP 5 – NOLAN SHARE OF THE VOTE IN LAOIS – OFFALY IN 2020
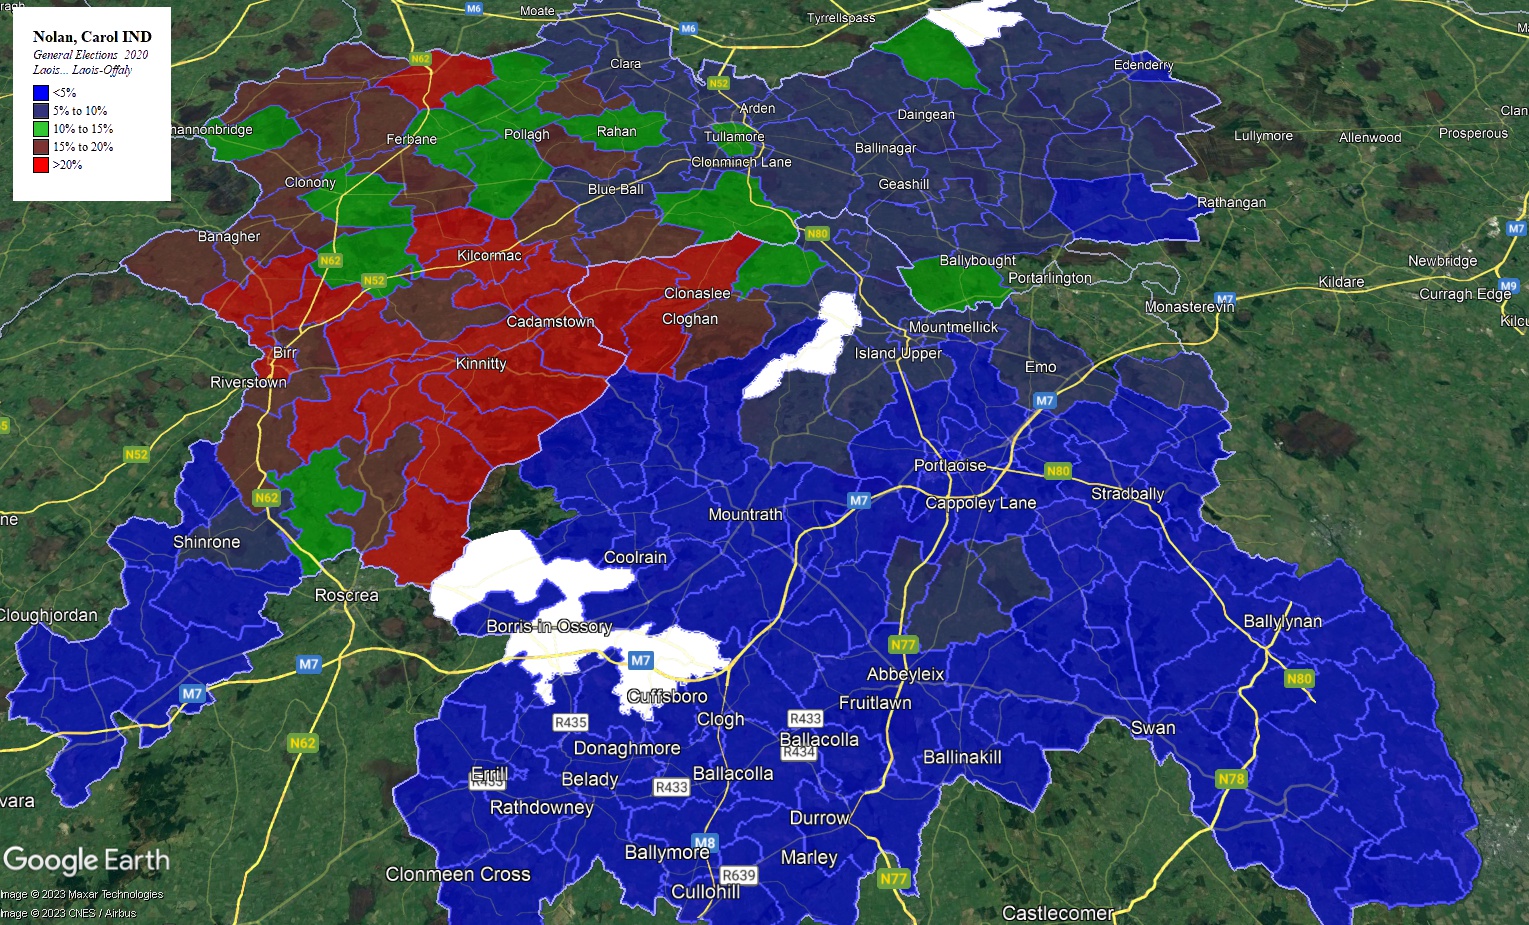
Overall approximately 20% of Nolan’s vote came from Laois. She polled particularly well in Clonaslee, just across the border from Cadamstown and Kinnity in North-West Laois where she took nearly 30% of the vote.
She also took over 5% in Mountmellick, Emo, Ballyfin and Ballyroan.
TABLE 5 – TOP POLLING STATIONS FOR NOLAN IN 2020
| CANDIDATE | C-Ken | Cowen | Leahy | Nolan | Ormond | Stanley |
| PARTY | FG | FF | IND | IND | FF | SF |
| Kinnity CC | 7% | 3% | 13% | 51% | 14% | 5% |
| Rashina NS | 19% | 13% | 10% | 27% | 10% | 7% |
| Birr NS | 9% | 7% | 9% | 25% | 18% | 22% |
| Clareen NS | 16% | 9% | 15% | 23% | 20% | 9% |
| Roscomroe NS | 13% | 5% | 6% | 22% | 25% | 11% |
| Birr Civic O | 19% | 9% | 5% | 22% | 17% | 14% |
| Kilcormac NS | 5% | 7% | 37% | 22% | 15% | 8% |
| Crinkle NS | 10% | 10% | 6% | 20% | 22% | 19% |
| Clonmacnoise | 14% | 23% | 7% | 19% | 12% | 15% |
| Rath Hall | 8% | 6% | 28% | 18% | 19% | 10% |
In 2020, only 2 of her top ten boxes were in Urban areas compared to 6 (of 11) in 2016.
Also, only 3 of the boxes in her top eleven in 2016 (Birr NS, Kinnity and Crinkle) appeared in the 2020 list.
Changes between 2016 and 2020
Below I have a look at the vote change in Nolan’s best polling boxes in both 2016 and 2020.
TABLE 6 – NOLAN VOTE CHANGE 2016-2020
| CANDIDATE | C-Ken | Cowen | Leahy | Nolan | Stanley |
| PARTY | FG | FF | IND | IND | SF |
| Kinnity CC | -8% | -18% | -13% | +21% | -24% |
| Rashina NS | 8% | -50% | +7% | +14% | -6% |
| Birr NS | -3% | -13% | -2% | -5% | -8% |
| Clareen NS | -13% | -16% | -3% | +9% | -5% |
| Roscomroe NS | -19% | -23% | -7% | +10% | |
| Birr Civic O | -12% | -18% | -4% | +10% | +2% |
| Kilcormac NS | -3% | -17% | -16% | +11% | -2% |
| Crinkle NS | -6% | -21% | -7% | +1% | -1% |
| Clonmacnoise | -20% | -23% | -1% | +14% | +10% |
| Rath Hall | -8% | -19% | -10% | +8% | |
| Tullamore Arden | -7% | -12% | -4% | -6% | +4% |
| Tullamore Kilcruttin | -9% | -13% | -7% | +3% | |
| Tullamore Convent Rd | -7% | -8% | -3% | -9% | +2% |
| Banagher | -5% | -21% | -4% | -1% |
NOTE : The large falls in Barry Cowen’s vote are at least partially due to the presence of Peter Ormond as a Fianna Fáil candidate in West Offaly in 2020, where Cowen would have been the premier Fianna Fáil candidate in 2016.
Nolan’s vote rose in 9 polling stations (most strikingly in Kinitty where her vote went from 30% to 51%), fell in 4 (including the three in Tullamore) and remained stationary in Banagher.
Also of note is that in John Leahy’s home polling station of Kilcormac, Nolan doubled her vote to cut Leahy’s lead from 41 points in 2016 to 15 points.
Both the Stanley and the Nolan swing are calculated from the Nolan vote in 2016; therefore – to take as example Crinkle where Nolan’s vote rose by 1 point from 2016, and the Sinn Féin vote fell by 1% – this effectively means that the Stanley/Nolan share of the vote effectively doubled from 2016.
Overall, Nolan’s vote increased and the Sinn Féin vote decreased in 5 (mainly rural) polling stations, By contrast the Sinn Féin vote increased and Nolan’s vote decreased in all three Tullamore Polling Stations.
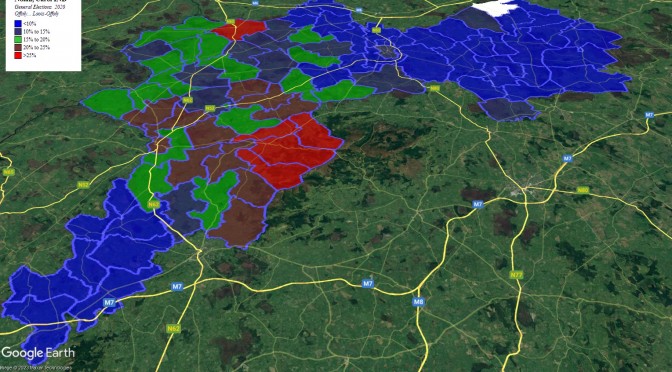
MAP 6 – NOLAN VOTE CHANGE 2016-2020
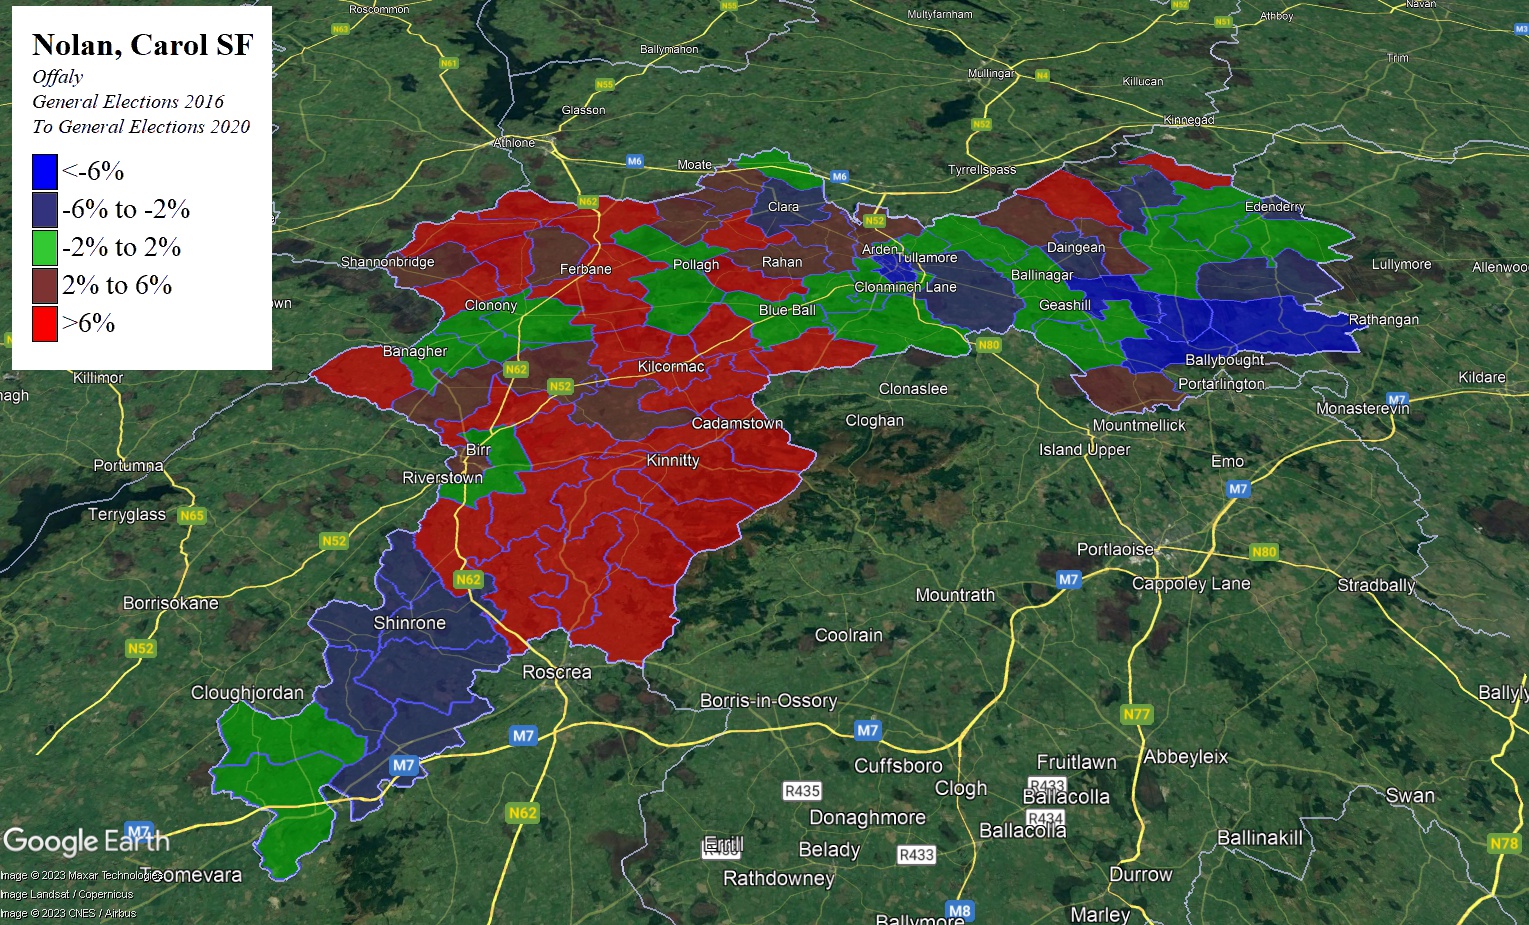
Nolan’s vote saw strong growth throughout West Offaly (barring the south-western tip where there was strong support for Fianna Fáil’s Peter Ormond).
It fell in the urban centres of Tullamore (where she still took 8%, a respectable tally) and Edenderry (where Brian Stanley took 40% of the vote and Ken Smollen of the Irish Democratic Party also polled surprisingly strongly).
Finally, I’m going to look at the relationship between a candidate’s vote by DED and the distance between that DED and the candidate’s base. In this instance I’m treating Nolan’s base as being the Cadamstown/Kinnity area.
Each point represents a DED – each DED where over 500 votes were (probably) tallied is named. The vertical axis measures the candidate percentage of the vote, the horizontal axis measures the distance of the DED from the candidate Base
GRAPH 1 – NOLAN’S VOTE IN OFFALY DEDS IN 2016
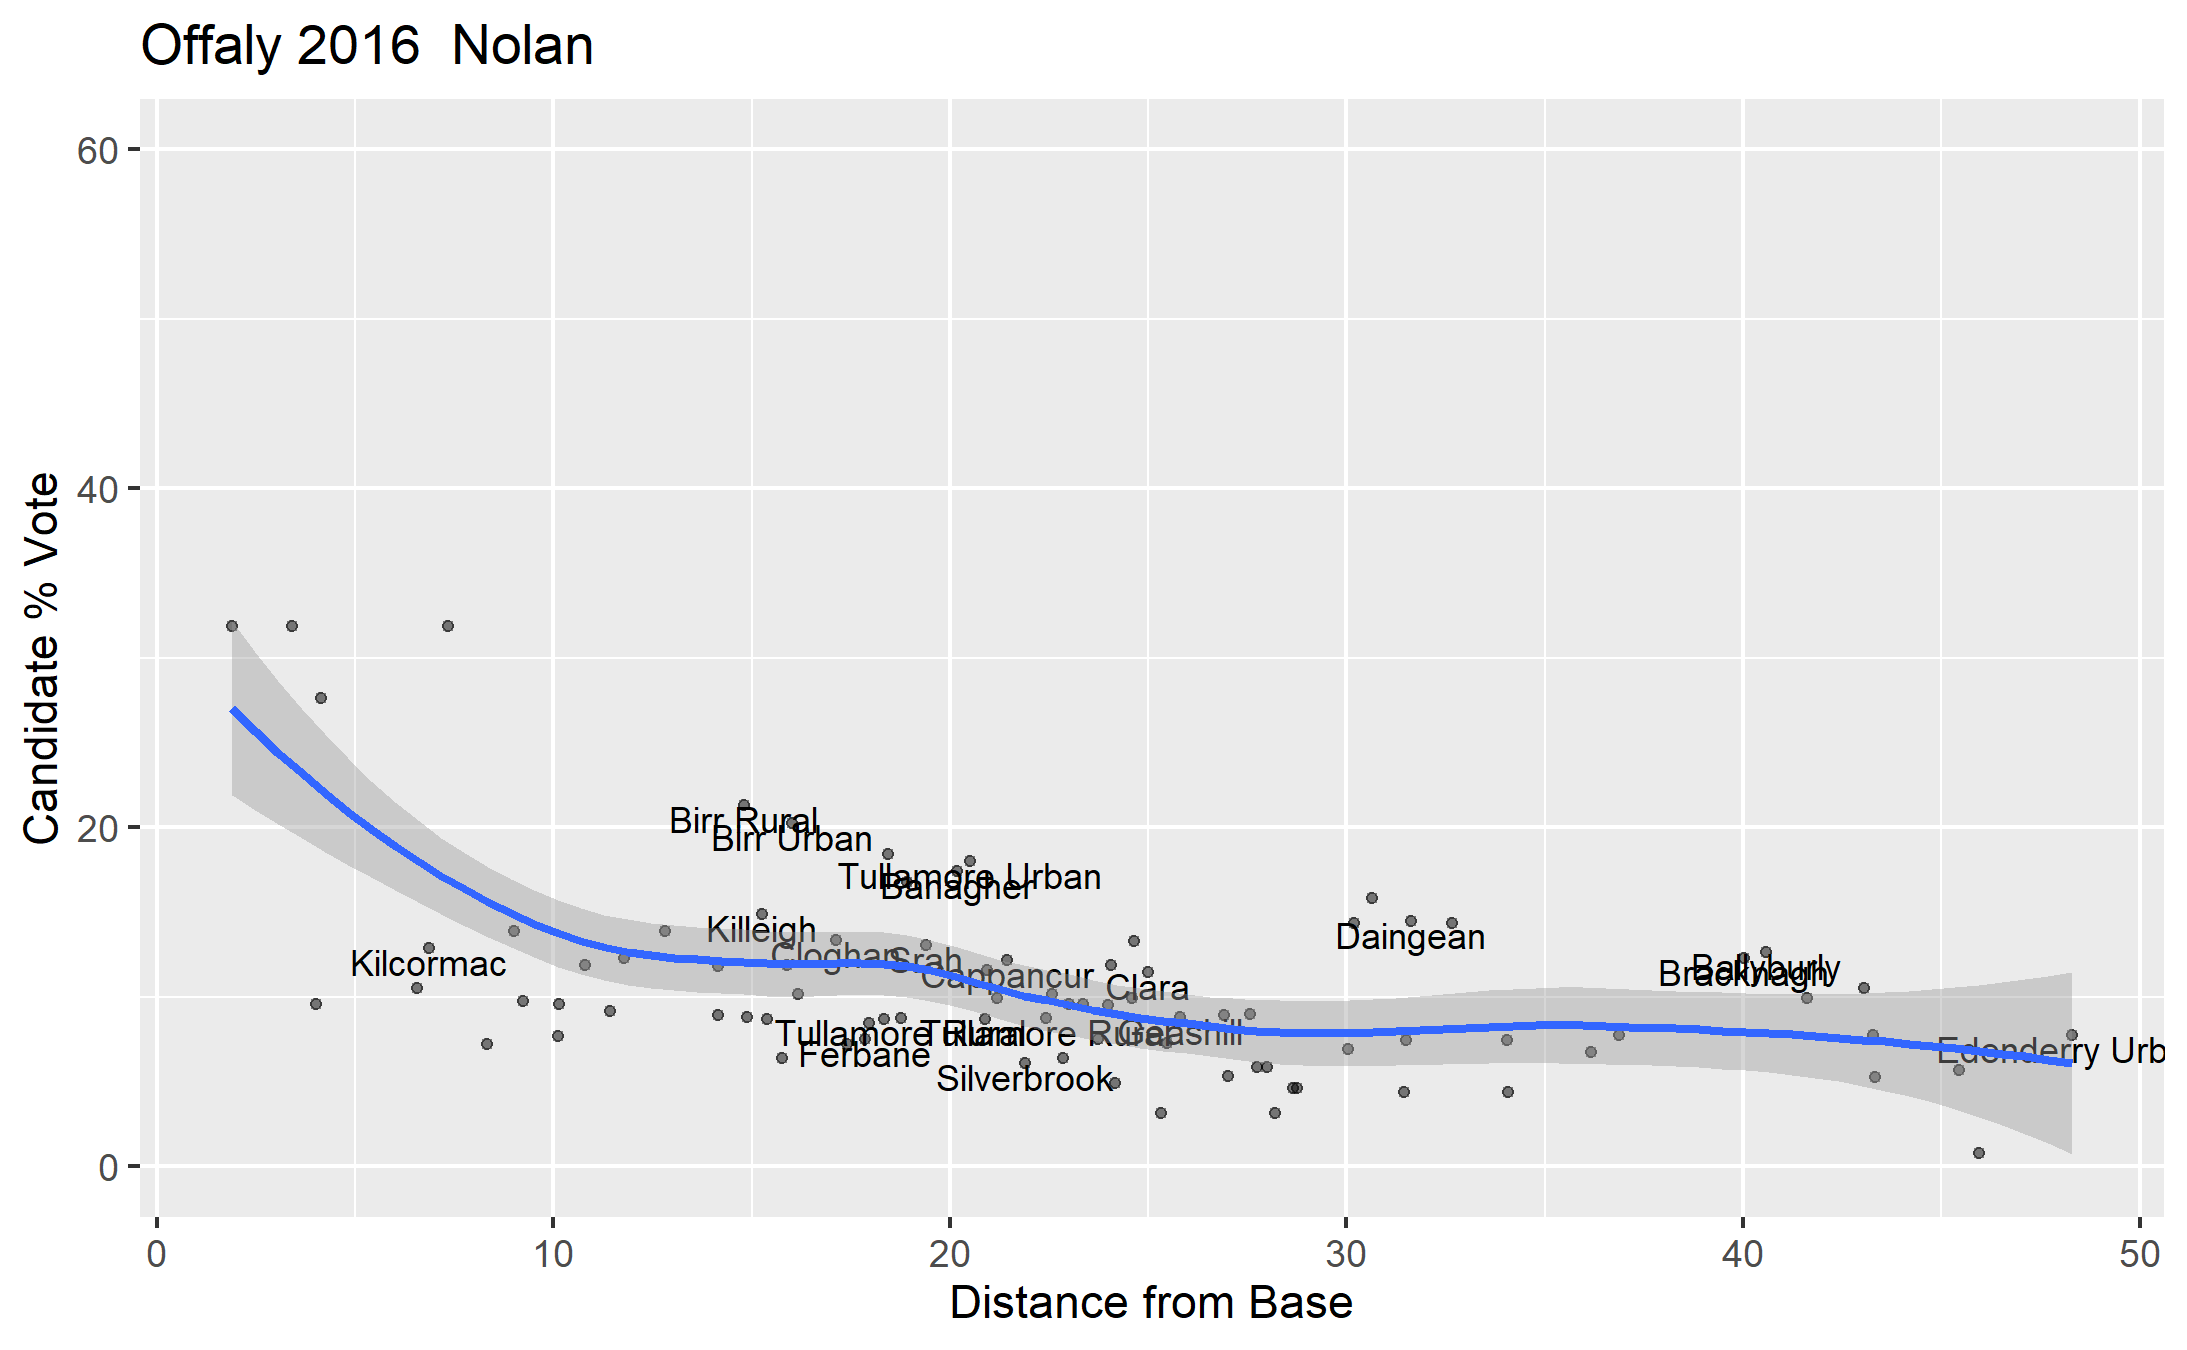
As can be seen, Nolan got about 25-30% in her immediate base, which declined to an average of about 10-15% in areas ten to twenty kilometres away, and further than twenty kilometres it declines to under 10%.
The slope of the regression line is quite slight, and there is a weak (-0.47) correlation between Nolan’s vote and the distance from her base.
GRAPH 2 – NOLAN’S VOTE IN OFFALY DEDS IN 2020
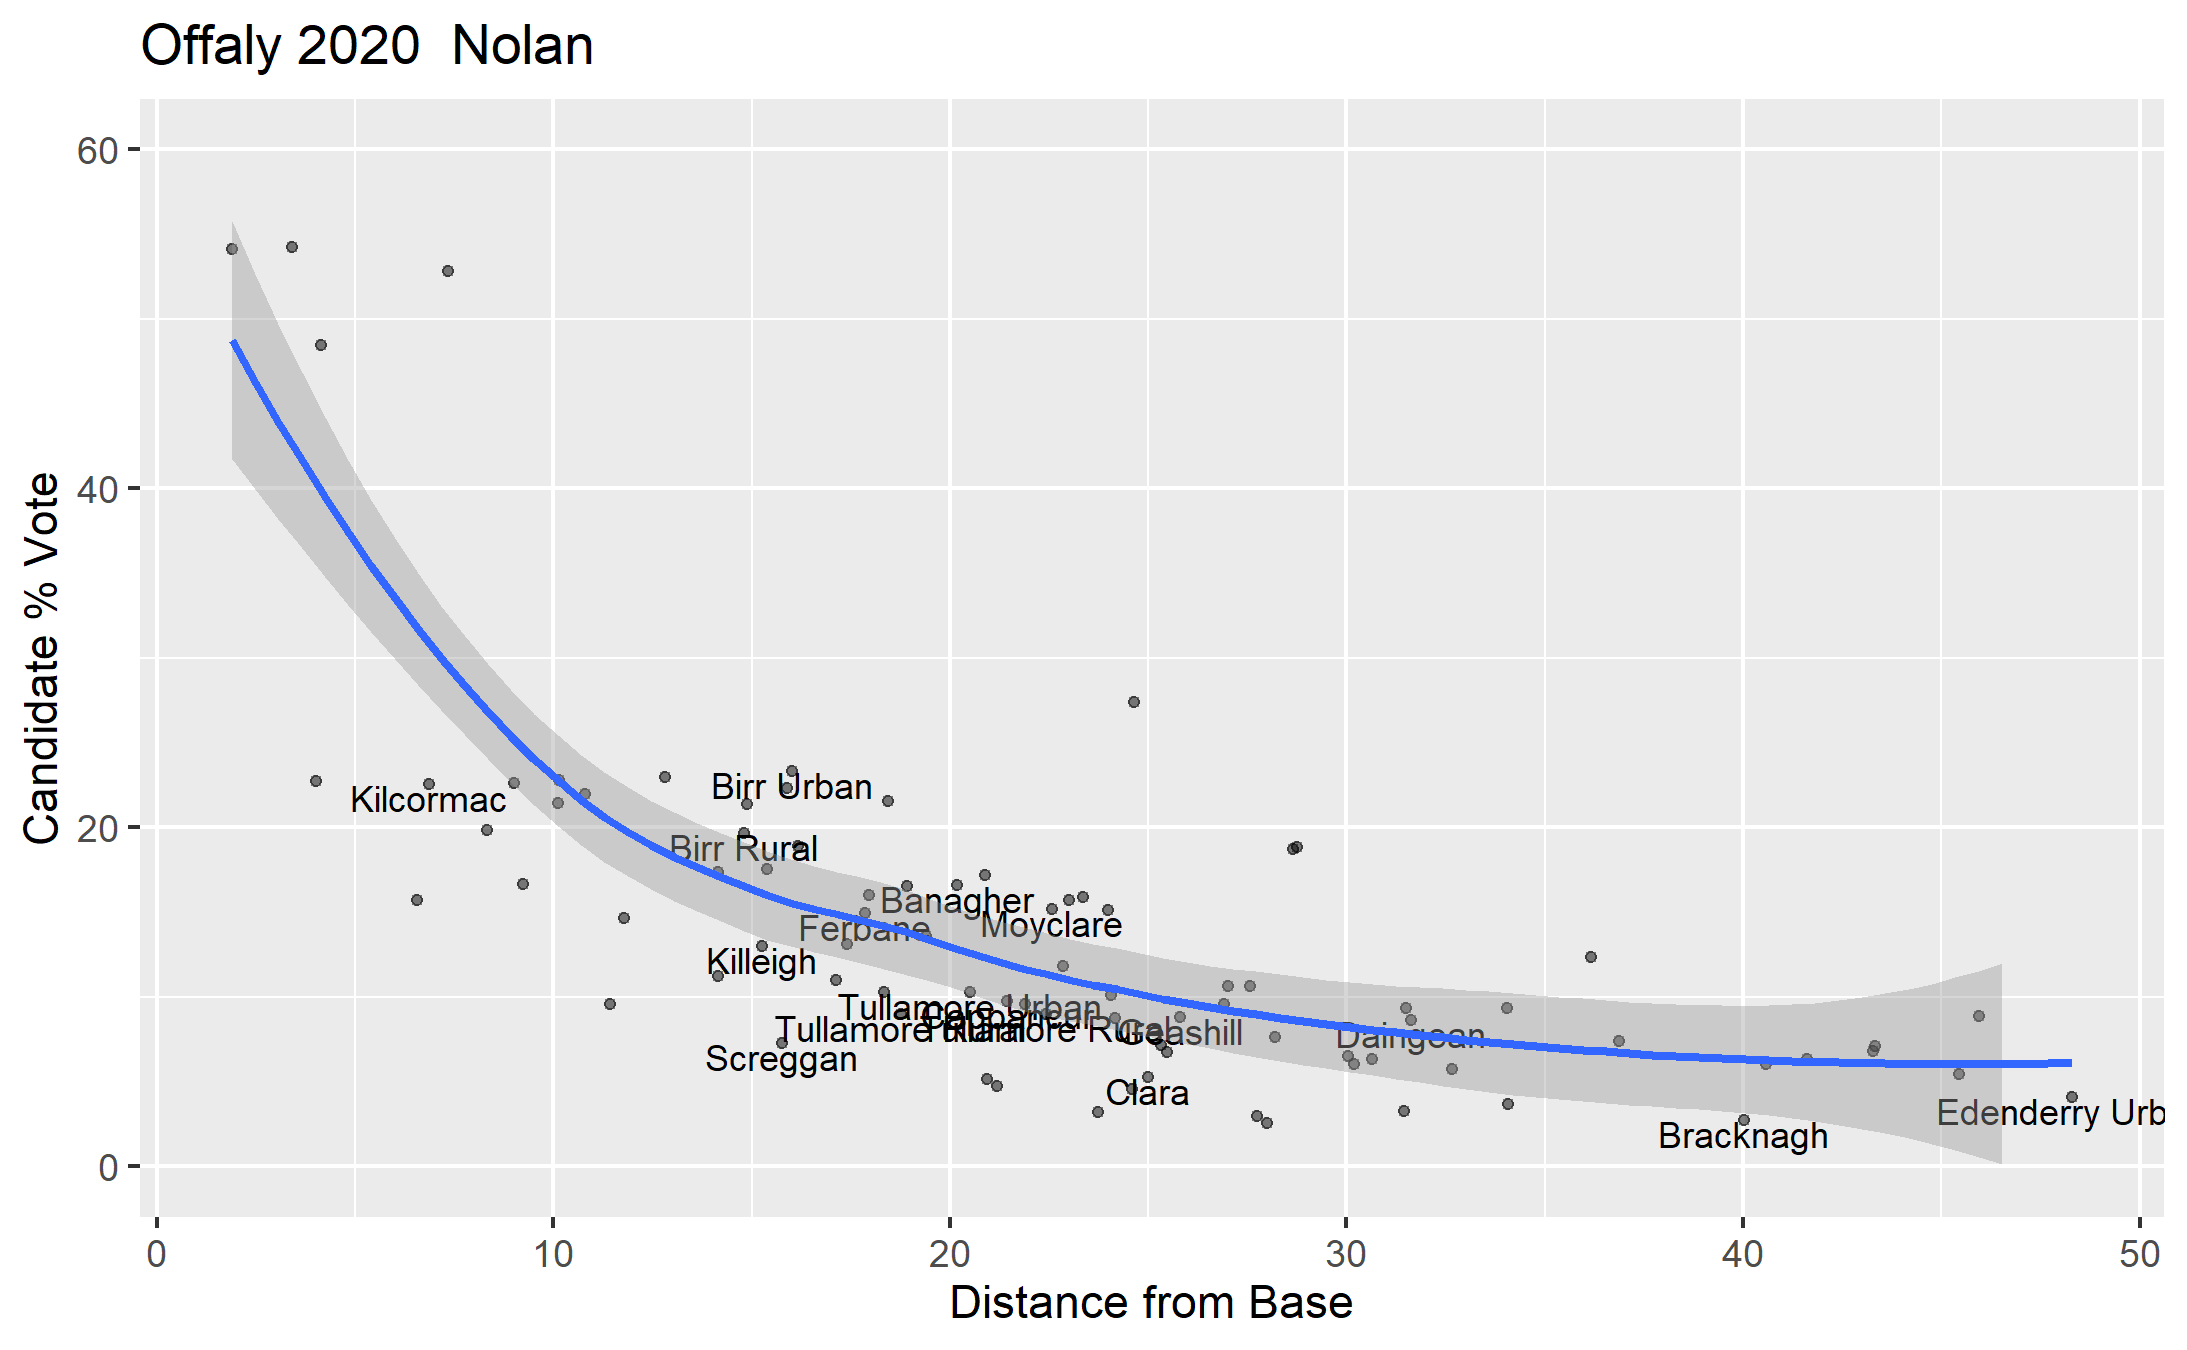
The first thing you notice in this second graph is that the vote in her immediate base is much higher.
It is also noteworthy that the slope of the regression line is more pronounced and – unlike its counterpart in 2016 – doesn’t plateau but rather continues on a downwards trajectory albeit getting gradually more gentle.
Correspondingly, the negative correlation between vote share and distance is more pronounced at -0.67.
Conclusion
Nolan only became a TD in 2016 through a series of fortunate events – an unbalanced Fianna Fáil vote share, the lack of sufficiently strong Independent candidates – and only took the last seat by less than 200 votes. Yet in 2020 – despite her vote tally actually falling slightly in Offaly, she took the 4th seat in Laois-Offaly (and 1 of only 2 in the Offaly portion) over five thousand votes ahead of the Green Party’s Pippa Hackett.
She proved significantly more transfer-friendly in 2020, taking a particularly large vote take from fellow Independent John Leahy – more than twice what she had received from him in 2016. This probably can be largely explained by their geographical proximity, their joint Independent status (they had previously been in ideologically opposed parties), and possibly their similar position on the Repeal Referendum.
Her vote in 2016 was equally divided between larger towns, smaller towns and villages and rural areas. Overall she polled slightly better in towns than she did in rural areas. In 2020 her vote fell in towns (particularly larger towns), but actually rose in rural areas – nearly half of her vote came from rural areas. This change can be seen in the 2016 and 2020 maps with significant gains for Nolan in the mainly rural North-West of Offaly.
Overall roughly 80% of Nolan’s vote came from Offaly, and 20% from Laois – most notably in Clonaslee (neighbouring her base Kinnitty) on the other side of the Slieve Bloom mountains and in Mountmellick further along the same road.
Generally speaking, Nolan’s vote where Sinn Féin’s vote rose (both swings being calculated against the Nolan/SF vote) where Nolan’s fell – particularly in Urban areas like Tullamore. However in some rurals both Nolan and Sinn Féin saw rises in their vote.
2020 saw a strengthened negative relationship between the size of Nolan’s vote and the distance from her base.