Recently the Phoenix published an article about the possible ramifications of the census – in particular population growth – on the redrawing of boundaries when figures become available. This is particularly pertinent because of the current constitutional requirement that there be that ratio of TDs to population be no more than 1:30,000 – which limit we were only just under in 2016. The population growth since then probably means that up to 10 extras seats will be required.
I’m going to take – roughly – the possible redrawing of boundaries proscribed by the Phoenix article, and look at the possible outcomes in the two putative constituencies – which I’m calling Dublin North Central and Dublin Fingal South – that would arise from the ashes of Dublin Bay North.
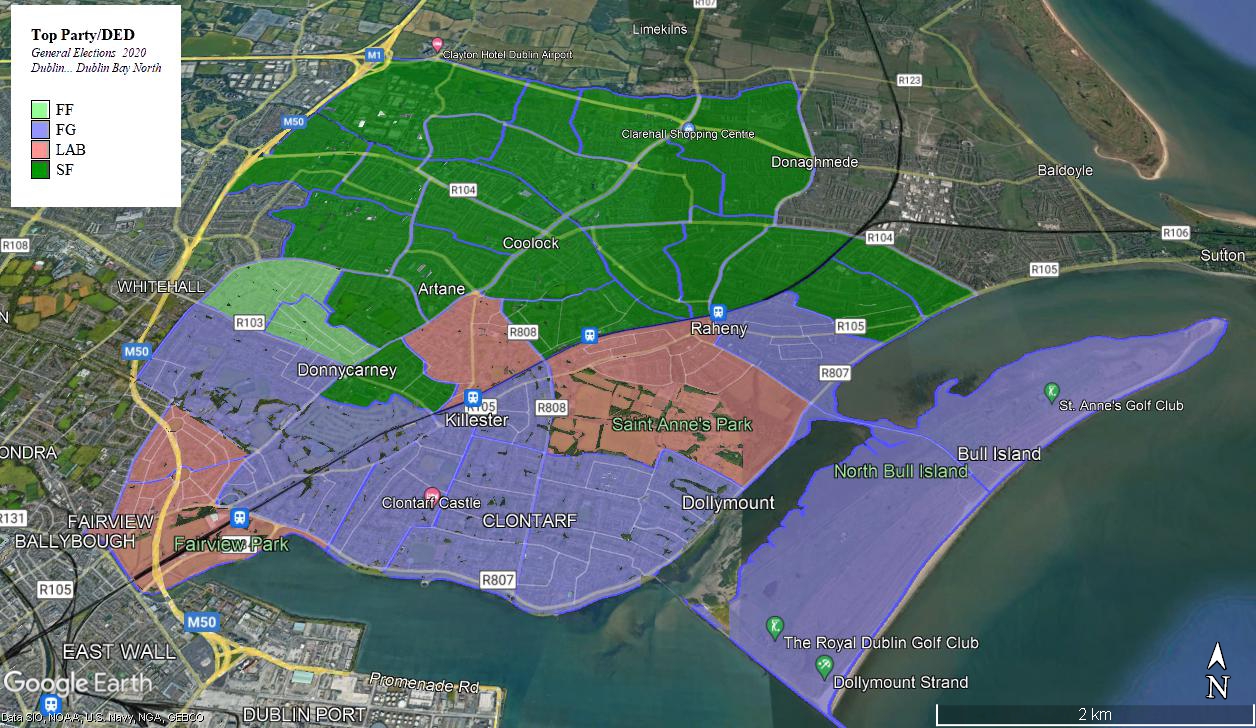
Dublin Bay North is a mix of strongly middle-class areas (mainly along the coast) where Fine Gael and centre-left parties perform better and strongly working-class areas in the north and west where Sinn Féin dominate the vote. The centre and south-west of the constituency are more socially mixed.
TABLE 1 -VOTE PERFORMANCE IN DED GROUPS IN “DUBLIN NORTH-CENTRAL”
| AREA | SF | FG | FF | GP | LAB | SD | LEFT | OTHER |
| Ayrfield | 46% | 13% | 11% | 6% | 6% | 7% | 3% | 10% |
| Beaumont | 24% | 19% | 21% | 6% | 12% | 8% | 3% | 7% |
| Clontarf East | 10% | 27% | 17% | 11% | 20% | 7% | 2% | 5% |
| Clontarf West | 20% | 19% | 16% | 10% | 17% | 8% | 4% | 6% |
| Edenmore | 48% | 12% | 13% | 4% | 5% | 6% | 3% | 9% |
| Grace Park | 15% | 21% | 20% | 9% | 16% | 8% | 5% | 5% |
| Grange | 34% | 16% | 14% | 11% | 7% | 3% | 4% | 9% |
| Harmonstown | 37% | 13% | 17% | 4% | 11% | 7% | 3% | 8% |
| Kilmore | 55% | 10% | 11% | 3% | 4% | 5% | 2% | 11% |
| Priorswood | 69% | 5% | 8% | 3% | 3% | 2%% | 2% | 10% |
| Raheny | 24% | 23% | 16% | 9% | 13% | 7% | 3% | 7% |
In 2020, Fianna Fáil, Fine Gael, Labour, Sinn Féin and the Social Democrats all took 1 seat apiece with the Greens the runners-up. Fianna Fáil collectively started off with four thousand votes more than the Social Democrats but owing to O’Callaghan’s transfer-friendliness he actually ended up 1,443 votes ahead of Haughey on the last count. This would suggest that Fianna Fáil would have been most vulnerable if Sinn Féin had run a second candidate – but a significant proportion of the 6,209 transfers O’Callaghan picked up were Sinn Féin votes percolating through the candidates.
TABLE 2 – SUMMARY OF MAIN CANDIDATES IN DBN IN 2020
| CANDIDATE | PARTY | 1st Count | 16th Count |
| Mitchell | SF | 21344 | Elected 1st count |
| Bruton | FG | 11556 | Elected 10th count |
| O’Riordain | LAB | 8127 | 11283 |
| Haughey | FF | 6651 | 10955 |
| O’Callaghan | SD | 6229 | 12438 |
| Healy | GP | 5042 | 8527 |
| Lyons | IND | 1882 | Eliminated |
| Mulvany | SOL-PBP | 1409 | Eliminated |
| Heney | FF | 3643 | Eliminated |
| Noone | FG | 2279 | Eliminated |
The three far-left candidates (Lyons, Mulvany and Michael O’Brien) had 4,013 votes between them on the first count; after Denise Mitchell’s surplus of 9,409 votes had been distributed, they had 8,989 votes – more than double their first count tally. Nearly 54% of Mitchell’s surplus went to the far-left. On the two last counts Lyons and Mulvany were eliminated, releasing 9.855 votes between them – O’Callaghan took a massive 3,706 votes compared to only 380 for Sean Haughey of Fianna Fáil. This moved O’Callaghan from 1,843 votes behind Haughey on the 14th count to 1,483 votes on 16th and final one. However – the majority of those O’Callaghan transfers from the Left were likely Sinn Féin number ones, meaning that if Sinn Féin had run a second candidate it is unlikely that O’Callaghan would have overtaken Haughey so eaily particularly as he would have been in direct competition with the second Sinn Féin candidate for a much reduced transfer. The unknowable is that Green transfers would likely have come into play on the last count, which might well have managed to push O’Callaghan ahead of Haughey and/or O’Riordain.
TABLE 3 : NOTIONAL VOTE IN “DUBLIN NORTH CENTRAL”
| PARTY | VOTE | % | 2020 +/- |
| SF | 15915 | 30.8% | +1.0% |
| FG | 9224 | 17.9% | -0.9% |
| FF | 7909 | 15.3% | +0.9% |
| LAB | 6287 | 12.2% | +0.9% |
| GP | 3516 | 6.8% | -0.2% |
| SD | 3368 | 6.5% | -2.2% |
| S-P | 1585 | 3.1% | -0.1% |
| AON | 792 | 1.5% | |
| IND | 3000 | 5.8% | +0.2% |
Perversely – on the raw tally figures – O’Riordain would have found it easier to gain election in a 4 seater Dublin North-Central (Dublin Bay North minus Howth, Sutton, Baldoyle and North Donaghmede) as Cian O’Callaghan’s vote would have been split between the new DNC a three seat Dublin Fingal South to the north; presumably O’Callaghan would run in the notional Fingal South constituency.
MAP 1 – PARTY DOMINANCE IN “DUBLIN NORTH-CENTRAL”
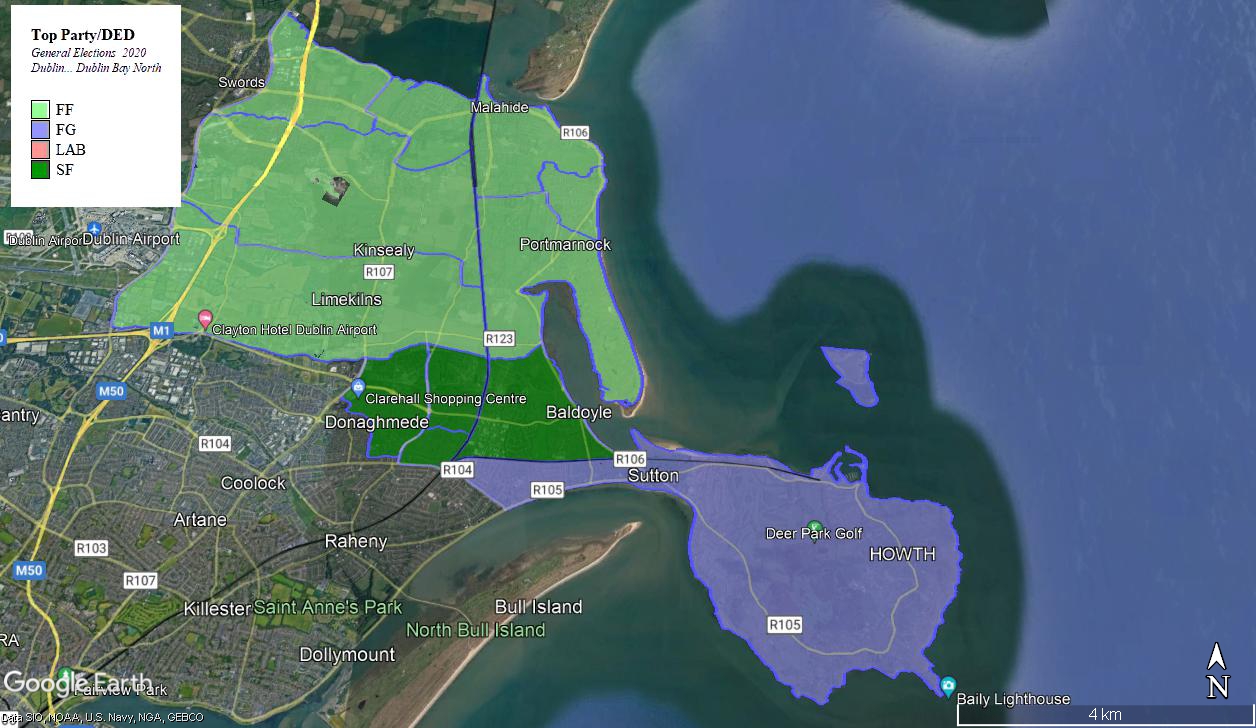
While Dublin North-Central would be a slight diminished Dublin Bay North, Dublin Fingal South would be comprised almost equally of of parts of Dublin Bay North and Dublin Fingal. Despite an initial appearance of being dominated by leafy coastal suburbia, there are significant lower middle and working class populations in North Donaghmede, Baldoyle and Kinsealy. There is also a mix of City and County, with Malahide and Portmarnock – towns with their own identity – displaying voting patterns which deviate significantly from those seen in metropolitan Dublin.
TABLE 4 – VOTE PERFORMANCE IN DED GROUPS IN “DUBLIN FINGAL NORTH”
| AREA | SF | FG | FF | GP | LAB | SD | LEFT | OTHER |
| Baldoyle | 27% | 17% | 11% | 8% | 9% | 19% | 3% | 6% |
| Grange | 44% | 12% | 10% | 5% | 10% | 8% | 4% | 7% |
| Howth | 12% | 29% | 11% | 13% | 8% | 21% | 2% | 4% |
| Sutton | 9% | 31% | 14% | 13% | 9% | 18% | 2% | 5% |
| Malahide | 12% | 21% | 38% | 16% | 4% | 3% | 3% | 3% |
| Balgriffin | 17% | 20% | 35% | 14% | 4% | 5% | 3% | 3% |
| Kinsealy | 25% | 14% | 33% | 14% | 4% | 3% | 4% | 4% |
| Portmarnock | 14% | 25% | 27% | 16% | 8% | 5% | 3% | 3% |
Malahide is a case in point – it’s a strongly middle-class town (60% of households have a middle-class breadwinner versus 25% with a working-class breadwinner), yet Fianna Fáil strongly outpoll Fine Gael here. In most areas with a similar social composition across Dublin, Fine Gael outpoll Fianna Fáil roughly 2 to 1 – Dublin South-West (another county constituency) is a partial outlier to this trend. The lesson perhaps is that the candidate factor is potentially stronger in towns and suburbs in the county area than it is in the city proper.
TABLE 5 – PARTY PERFORMANCE IN AREAS 55%-65% MIDDLE-CLASS
| CONSTITUENCY | FF | FG | SF | GP | LAB | OTH | |
| FINGAL | 37% | 23% | 10% | 16% | 5% | 9% | |
| BAY NORTH | 16% | 31% | 9% | 12% | 16% | 15% | |
| SOUTH-WEST | 25% | 28% | 9% | 12% | 9% | 17% | |
| BAY SOUTH | 16% | 33% | 10% | 23% | 8% | 11% | |
| WEST | 19% | 36% | 9% | 19% | 5% | 12% | |
| RATHDOWN | 13% | 32% | 10% | 21% | 9% | 15% | |
| DUN LAOGHAIRE | 17% | 40% | 5% | 17% | 5% | 17% | |
| TOTAL | 19% | 33% | 8% | 18% | 8% | 14% |
In Dublin Fingal South, the result would be much more straightforward with Fianna Fáil, Fine Gael and Sinn Féin all close to a quota on the first count. Fine Gael and the Greens draw support from the more middle-class areas of the constituency, while the reverse is true of Sinn Fein. Fianna Fail’s vote is better explained by the personal popularity of Darragh O’Brien.
TABLE 6 : NOTIONAL VOTE IN “DUBLIN FINGAL SOUTH”
| PARTY | VOTE | % |
| FF | 8269 | 23.1% |
| FG | 7605 | 21.2% |
| SF | 7558 | 21.1% |
| GP | 4180 | 11.7% |
| SD | 3290 | 9.2% |
| LAB | 2614 | 7.3% |
| S-P | 681 | 1.9% |
| AON | 159 | 0.4% |
| IND | 1626 | 4.5% |
The Greens would be on just under 12% – their TD Joe O’Brien would be much more likely to run in a putative “Fingal North” constituency where (unusually for a Green candidate) he has a strong personal support base particularly in Skerries. The Social Democrats would be on 9% but it is likely that Cian O’Callaghan’s presence on the ticket would improve that given he was a Councillor for the Howth-Malahide ward prior to his election to the Dail – however taking a seat could prove to a tall order.
MAP 2 – PARTY DOMINANCE IN “DUBLIN FINGAL SOUTH”