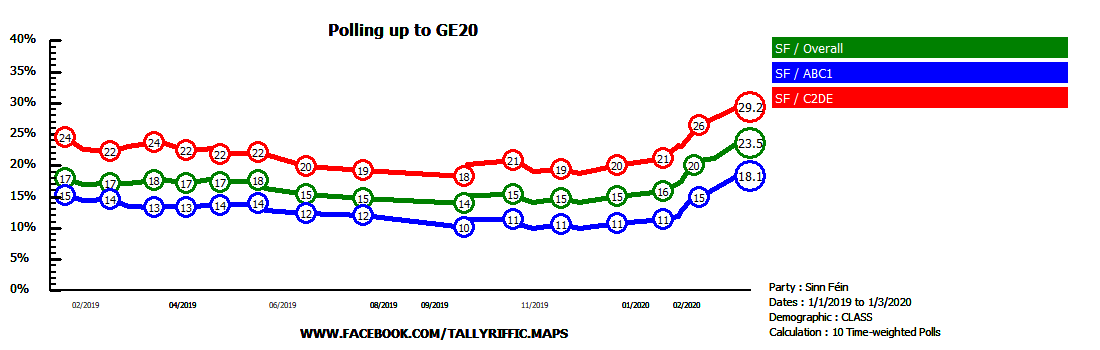
The following figures are based upon time-weighted averages of polling figures for the whole of Ireland and the four geographical regions used for polling – Dublin, Leinster, Munster and Connaught-Ulster.
These figures are then used to provide counts with projected transfer rates for each of the new constituencies that will be in place for the new constituencies.
| PARTY | VOTE | +/- | SEATS | +/- |
| SINN FEIN | 27% | +2% | 54 | +17 |
| FINE GAEL | 19% | -2% | 39 | +4 |
| FIANNA FAIL | 17% | -5% | 36 | -2 |
| OTHERS* | 10% | +1% | 12 | nc |
| LABOUR | 4% | nc | 4 | -2 |
| GREENS | 4% | -3% | 1 | -11 |
| INDEPENDENTS | 19% | +7% | 28 | +9 |
*OTHERS includes – Social Democrats, Solidarity and People Before Profit, and Aontu. I hope to update the database to treat them individually next time.
Looking at those numbers in terms of blocs, the Government parties (Fianna Fáil, Fine Gael and the Greens) would take 40% of the vote and 76 of the 174 seats – 12 short of a majority. The Opposition (Sinn Féin, Social Democrats, Labour, Solidarity and People Before Profit, and Aontu) would take 41% of the vote and 70 of the 174 seats – 18 short of a majority.
I’d have to add a caveat that the Social Democrats seat total is probably underestimated given that they are polling strongly – on the other hand the only other constituency they polled decently in in 2020 (besides the six constituencies they won a seat in) was Galway West, and their seat in Cork South-West – not withstanding her elevation to their leadership – could potentially be vulnerable on paper at least.
Below I’ve drawn – using my rather basic Matplotlib Skills – the proportions of seats each party/block would take per region. The Government parties are shaded in Green, the opposition parties in Red, and Independents in Gray.
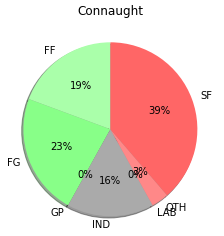
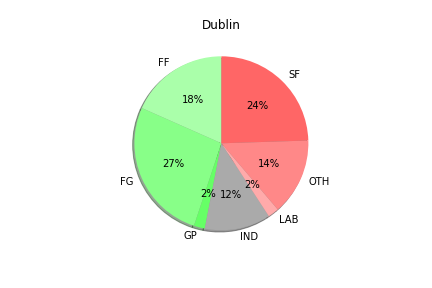
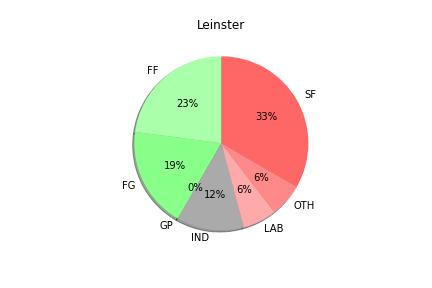
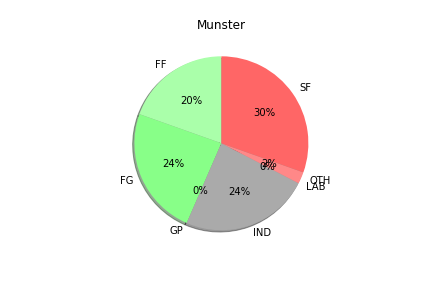
The first thing to notice is that in none of the regions do either the Government or Opposition Blocs take a majority of the seats in any region – the number of Independents in all regions prevents such. The government take 47% of the seats in Dublin, and the Opposition 45% in Leinster but that is the closest either come.
Sinn Féin are the biggest party in all regions apart from Dublin, where Fine Gael have the edge. Both Sinn Féin and Fianna Fáil are ahead of Fine Gael in Leinster.
| PARTY | GAINS | LOSSES |
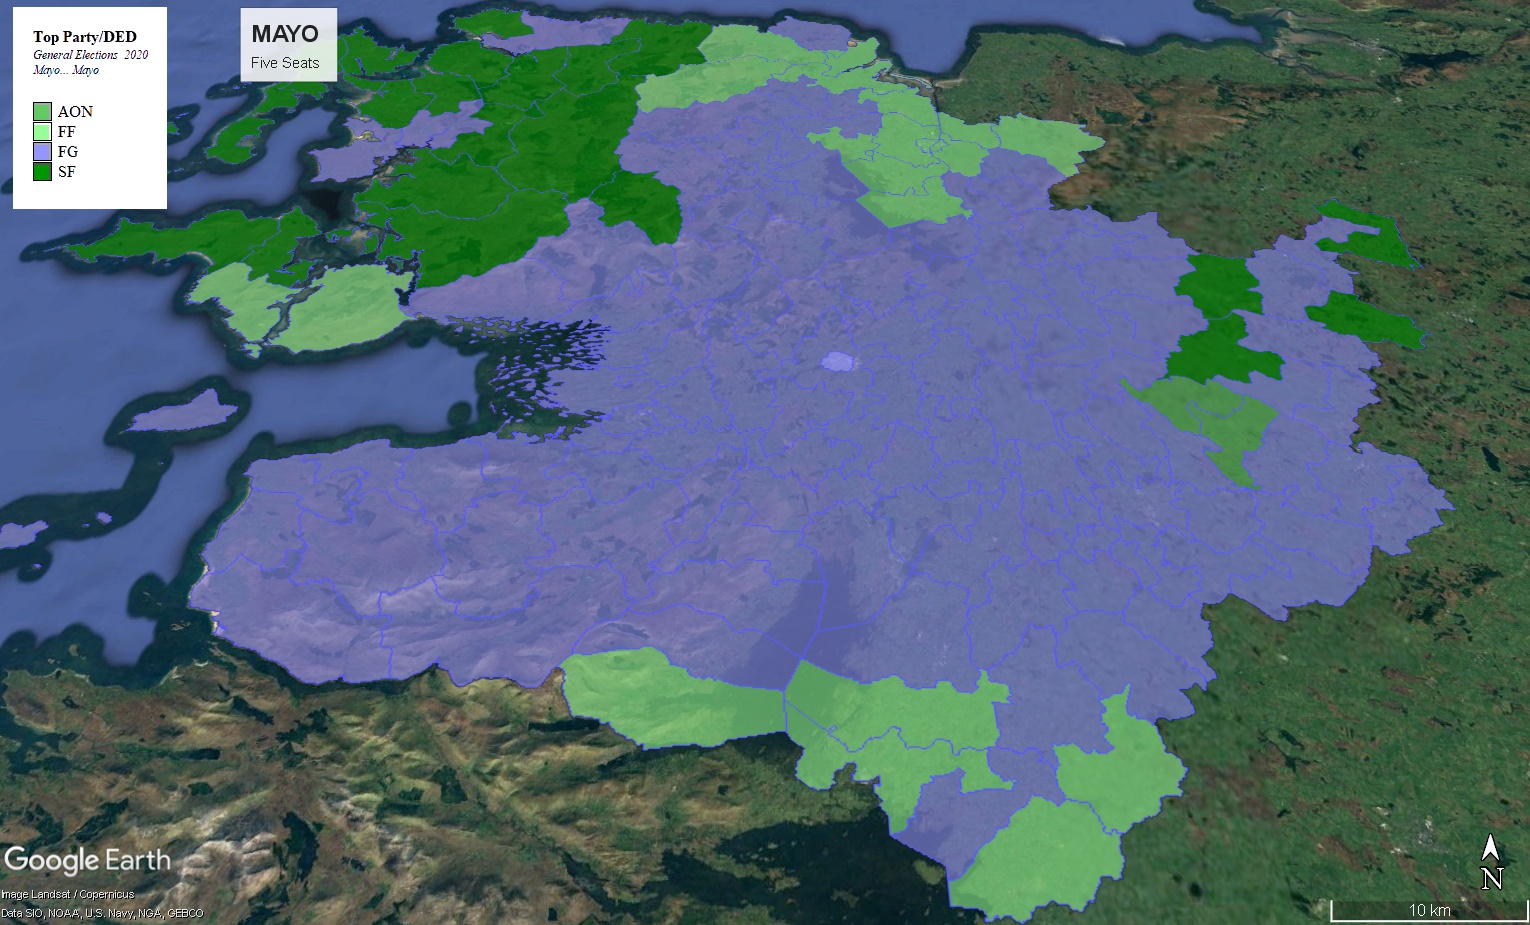
| SF | DUBLIN :Dublin Fingal, Dublin South-Central / LEINSTER : Carlow-Kilkenny, Laois-Offaly, Louth, Wexford, Wicklow / MUNSTER : Cork North-Central, Cork South-Central, Cork South-West, Limerick County, Tipperary, Waterford / CONNAUGHT-ULSTER : Donegal, Galway East, Mayo, Sligo-Leitrim | |
| FG | DUBLIN : Dublin North-West, Dublin South-Central, Dun Laoghaire MUNSTER : Cork South-West, Tipperary | LEINSTER : Meath West |
| FF | DUBLIN : Dublin Fingal, Dublin Mid-West, Dublin Rathdown / LEINSTER : Meath West | DUBLIN : Dublin North-West / LEINSTER : Kildare South / MUNSTER : Cork North-West, Cork South-West, Limerick County / CONNAUGHT-ULSTER : Cavan-Monaghan |
| GP | DUBLIN : Dublin Central, Dublin Fingal, Dublin Rathdown, Dublin South-Central, Dublin South-West, Dublin West, Dun Laoghaire / LEINSTER : Carlow-Kilkenny, Wicklow / MUNSTER : Limerick City / Waterford | |
| SD | MUNSTER : Cork South-West | |
| LAB | LEINSTER : Kildare North, Kildare South | DUBLIN : Dublin Fingal / LEINSTER : Louth / MUNSTER : Cork East, Tipperary |
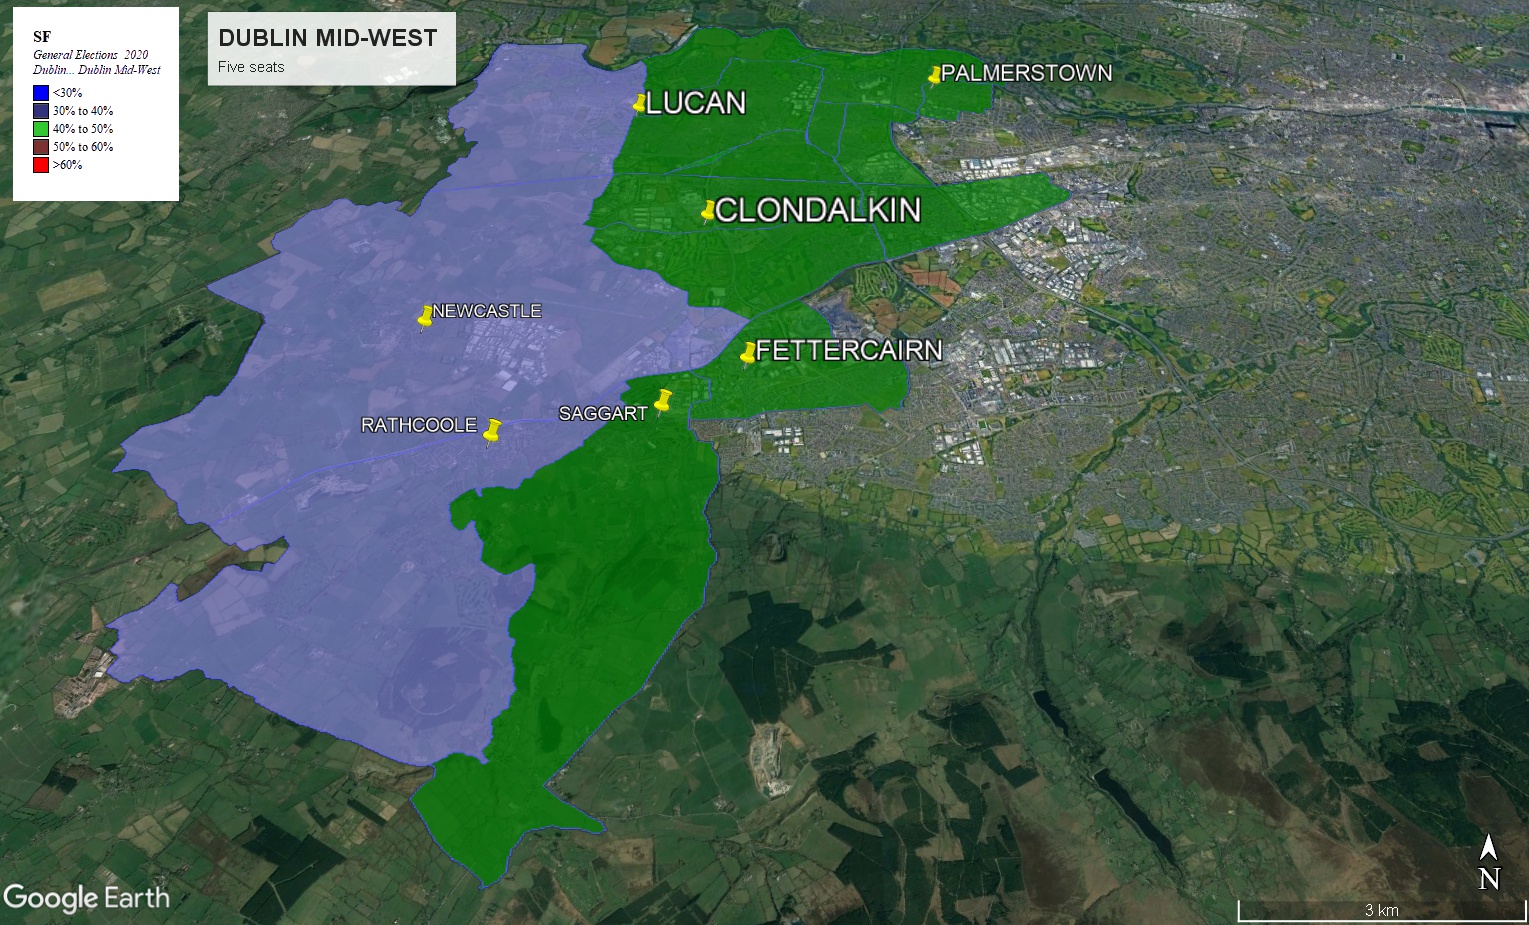
| LEFT | DUBLIN : Dublin West | DUBLIN : Dublin Mid-West, Dublin South-Central / MUNSTER : Cork North-Central |
| AON | MUNSTER : Cork North-West / CONNAUGHT-ULSTER : Cavan-Monaghan | |
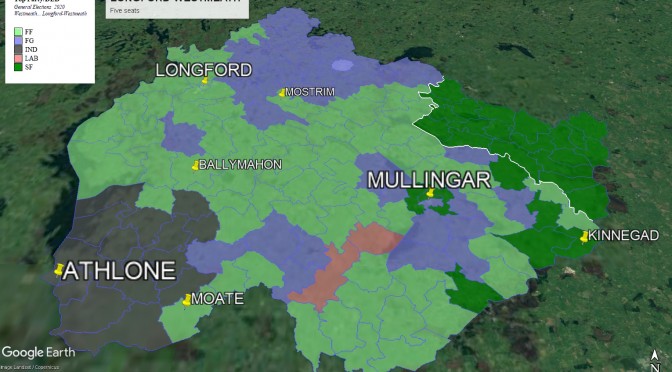
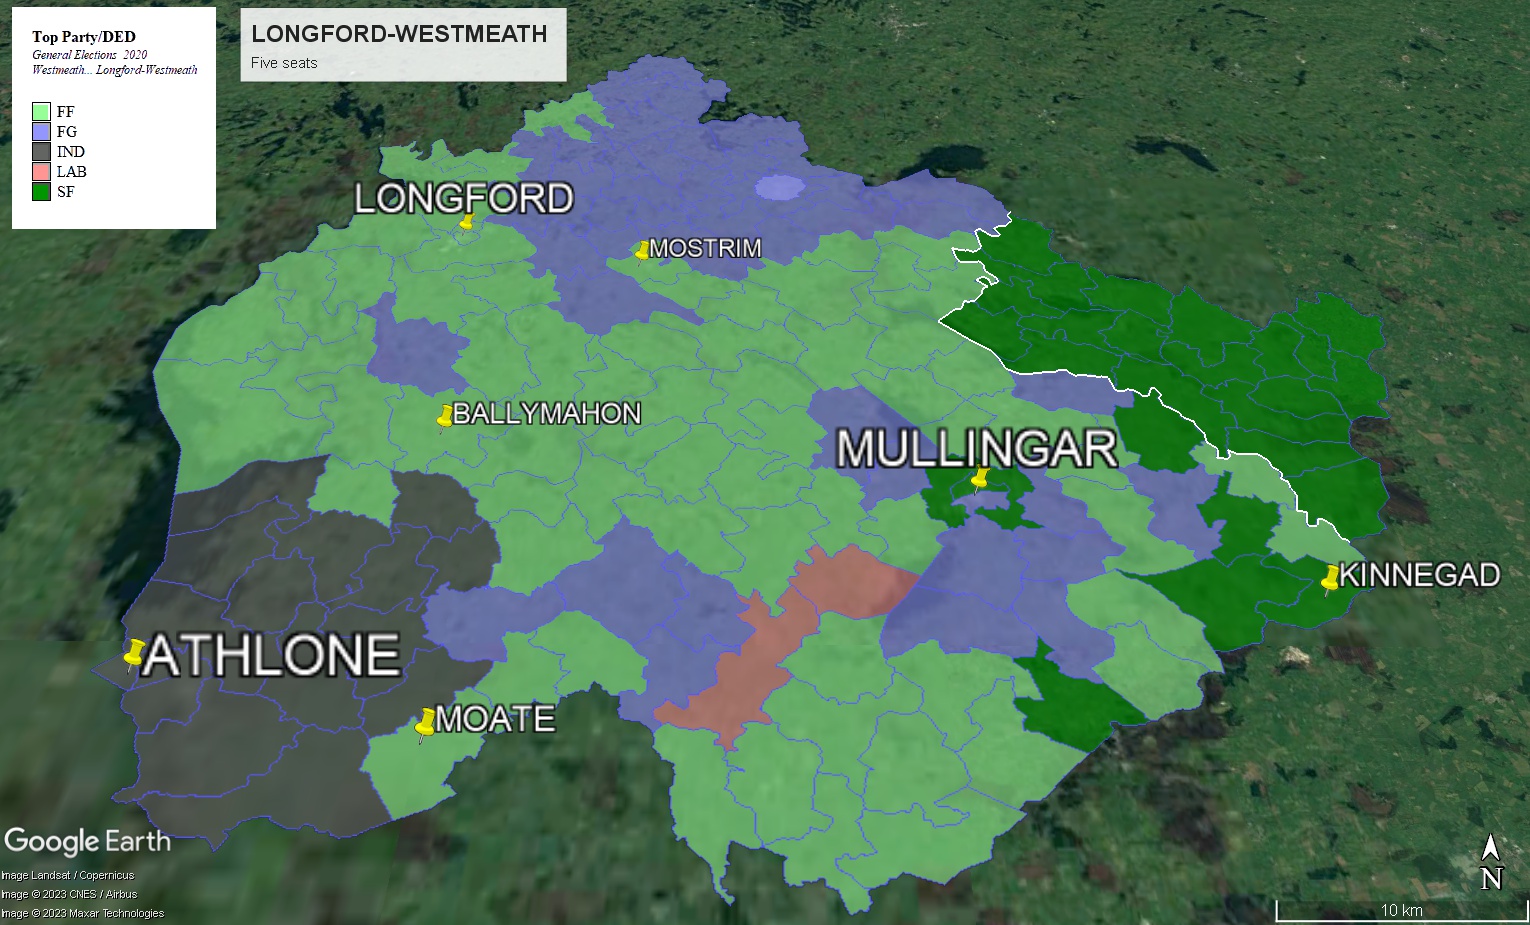
| INDS | DUBLIN : Dublin Fingal, Dublin Mid-West, Dublin Rathdown, Dublin South-West / LEINSTER : Longford-Westmeath / Meath East / MUNSTER : Cork East, Cork North-Central, Limerick City | CONNAUGHT-ULSTER : Donegal / Sligo-Leitrim |
CAVEAT : The above seat changes and the calculations are based solely on regional swings – they’re not based on demographics, candidates etc.
The first thing to note is that Sinn Féin only make limited gains in Dublin – in 2020 despite gaining nearly two quotas in Dublin Bay North, Dublin Central, Dublin South-Central, Dublin South-West and Dublin Bay North, the party only had one candidate standing in each constituency. However, the recent patterns in poll averages has been that despite Sinn Féin gaining everywhere else in the country, they are losing ground in Dublin. In fact according to this Poll Average, at the moment they would only take an extra seat in one of the five constituencies mentioned above – Dublin South-Central. There would also take an extra seat in the Fingal area by taking seats in both the newly-formed Fingal East and Fingal West – Fingal West in particular looks likely to be a very interesting constituency with Sinn Féin the only racing certainty.
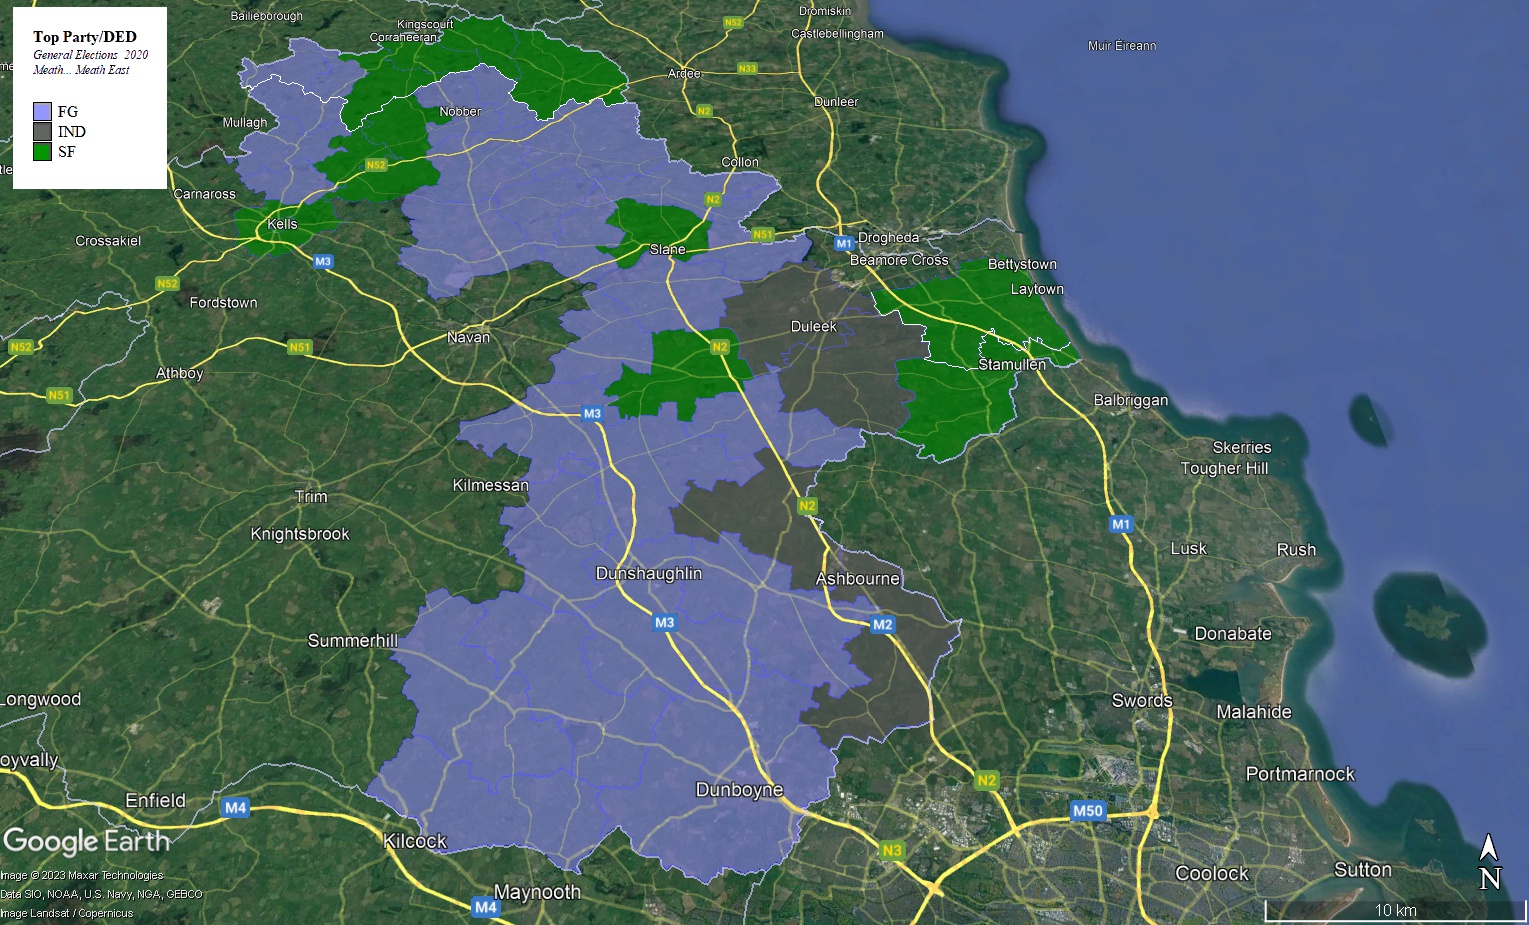
Altogether, they take fifteen extra seats across the rest of the country – including three gains in Cork and their share of the seats in Wexford and Wicklow jumping from two out of ten in 2020 to a suggested four out of eleven now. Their sole loss would be in Meath East where they just over a thousand votes ahead of Fianna Fáil on the final count.
By contrast, Fine Gael would make three gains in the capital but only cumulative gain elsewhere – their vote rises in Dublin, but retreats slightly beyond the M50. Similarly, Fianna Fáil would make two cumulative gains in Dublin – helped by additional seats awarded to Dublin Mid-West and Dublin Rathdown in the Constituency Revision – but would suffer the loss of four seats in Munster and Connaught-Ulster. The Connaught-Ulster seat is Cavan-Monaghan and that constituency is building up to be a fascinating contest in the next election.
In previous analyses, the Green Party generally held onto three or four seats in Dublin (while being wiped out beyond the M50) due to their vote holding up relatively well in the Capital. However a further slide in their vote there sees them only holding on in Dublin Bay South – and this analysis is based upon the 2020 General Election figures, not the 2021 bye-election. In Fingal, Joe O’Brien, despite being one of the few Green TDs to have a strong local base in the town of Skerries (35% in 2020, 51% in the 2019 bye-election), sees his vote cut in half by the partition of Fingal.
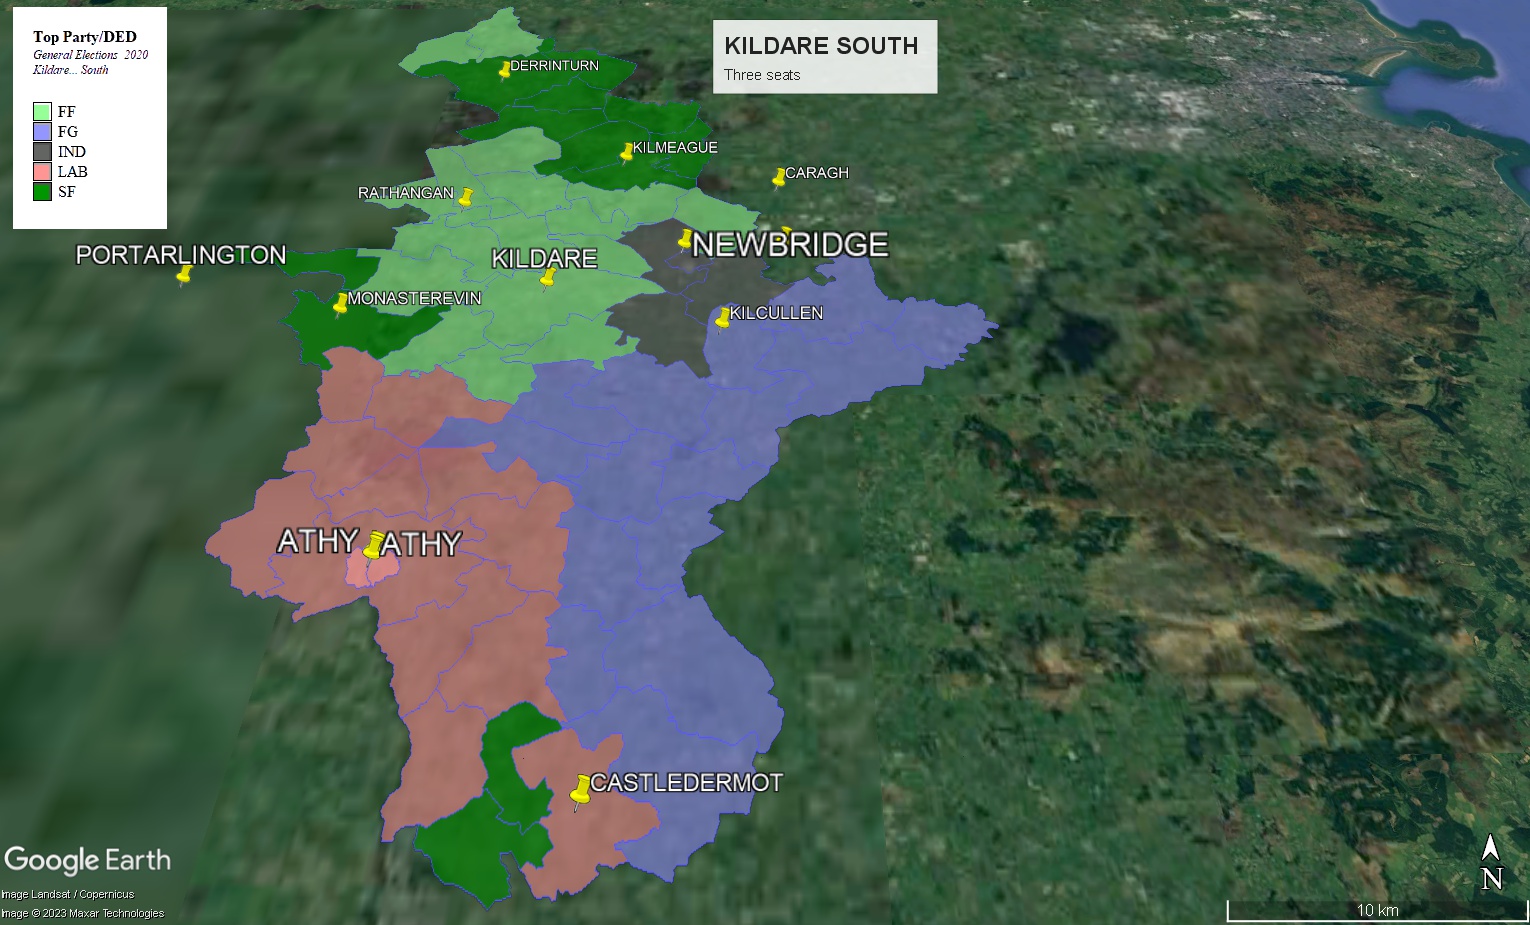
Almost quixotically, the predictor throws up two gains for Labour – both in Kildare. In Kildare South, a four seat contest would give Labour a good chance of leveraging their massive support in the south of the constituency around Athy to take a seat. The situation in Kildare North is more complex – the first four seats are straightforward, with Fianna Fáil, Fine Gael, Sinn Féin and the Social Democrats all between a quota and a quota and a half. If Labour can get close to half a quota on the – and a decent transfer off the Greens – they’d have a reasonable chance of being competitive for the last seat. Elsewhere, they are looking at almost certain losses in Dublin Fingal West and Cork East, and possibly Tipperary (North) and Louth. In the latter two constituencies, Alan Kelly’s fate will be largely determined by the vote in the town of Nenagh and the accompanying baronies of Owney and Arra and Upper Ormond, while in Louth Ged Nash is dependent on the vote in Drogheda. Louth’s remaining TDs are largely reliant on the electoral largesse of localised fiefdoms.
As regards the Smaller parties, Solidarity/People Before Profit and Independents For Change are facing possible losses in Dublin South-Central, Dublin Mid-West and Cork North-Central. On the plus side, the extra seat in Dublin West should see a gain there.
The calculator suggests a loss of Holly Cairns’ seat in Cork South-West on the cold hard figures, but whether that transpires in is another matter. It also suggests possible gains for Aontu in Cork North-West and Cavan-Monaghan (the contest there I’ve already alluded to). In Cork North-West, Aontu polled very respectably in defeat in 2020 and started ahead of both the Greens and Social Democrats – the removal of Ballincollig from the constituency will also aid them.
Lastly, the predictor predicts a slew of Independent gains across Dublin, Leinster and Munster. Whether they materialise – ie whether an independent candidate capable of taking them will be in situ in each constituency – is another question.
Thanks for reading. I hope to have a fuller report next time with more graphics.