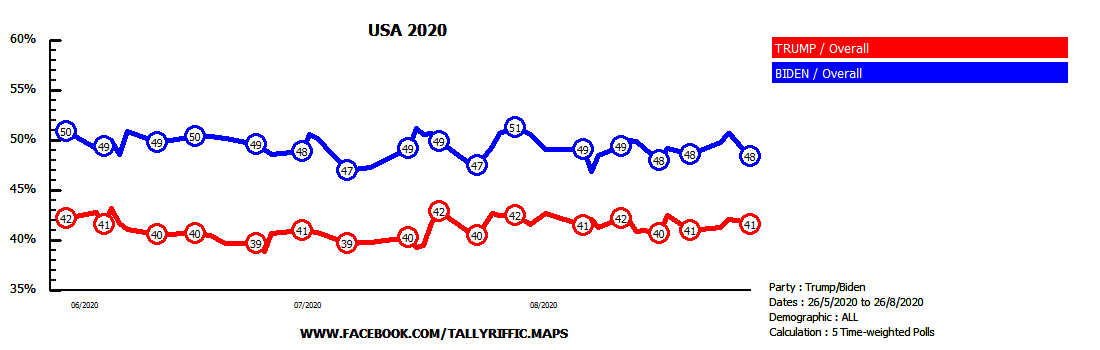
The following is a table of possible vote results calculated using a time-weighted average of the last five opinion polls. To get the regional results, we similarly do a time-weighted average of the regional results in the last five opinion polls where such data is available and weight them to the overall average calculated above.
| Area/Party |
FG |
SF |
FF |
GP |
LAB |
OTH |
IND |
| DUBLIN |
36% +15 |
26% -1 |
7% -8 |
7% -5 |
5% -1 |
10% -2 |
9% +1 |
| LEINSTER |
36% +15 |
29% +3 |
16% -9 |
2% -4 |
5% |
5% -2 |
7% -3 |
| MUNSTER |
30% +10 |
27% +7 |
14% -12 |
4% -2 |
5% |
4% -1 |
16% -2 |
| CONNAUGHT-ULSTER |
36% +13 |
30% +3 |
15% -7 |
2% -3 |
1% |
5% -1 |
11% -4 |
| IRELAND |
34% +13 |
28% +3 |
13% -9 |
4% -3 |
4% |
6% -2 |
11% -1 |
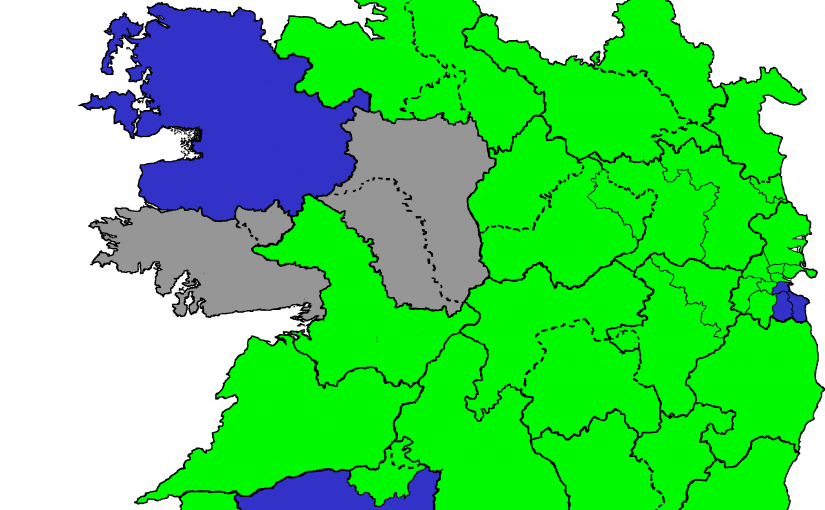
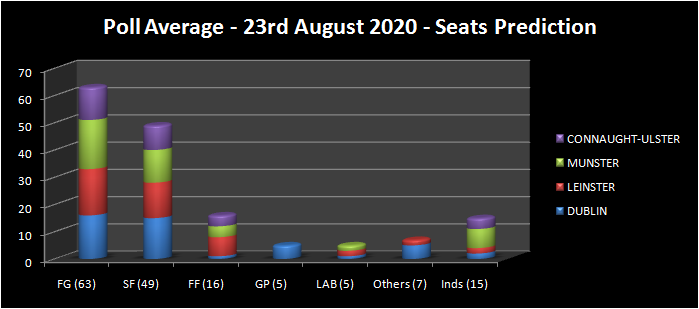
This table shows how many seats each party would be likely to win in each region based on the regional swings. Full counts are processed in each constituency in many cases using localised transfer data
| Area/Party |
FG |
SF |
FF |
GP |
LAB |
OTH |
IND |
| DUBLIN |
16 +6 |
15 +5 |
1 -6 |
5 -3 |
1 -1 |
5 -3 |
2 +2 |
| LEINSTER |
17 +7 |
13 +2 |
7 -4 |
-2 |
2 |
2 |
2 -3 |
| MUNSTER |
18 +9 |
12 +4 |
4 -9 |
-2 |
2 |
-1 |
7 -1 |
| CONNAUGHT-ULSTER |
12 +5 |
9 +1 |
4 -3 |
|
|
|
4 -3 |
| IRELAND |
63 +28 |
49 +12 |
16 -22 |
5 -7 |
5 -1 |
7 -6 |
15 -4 |
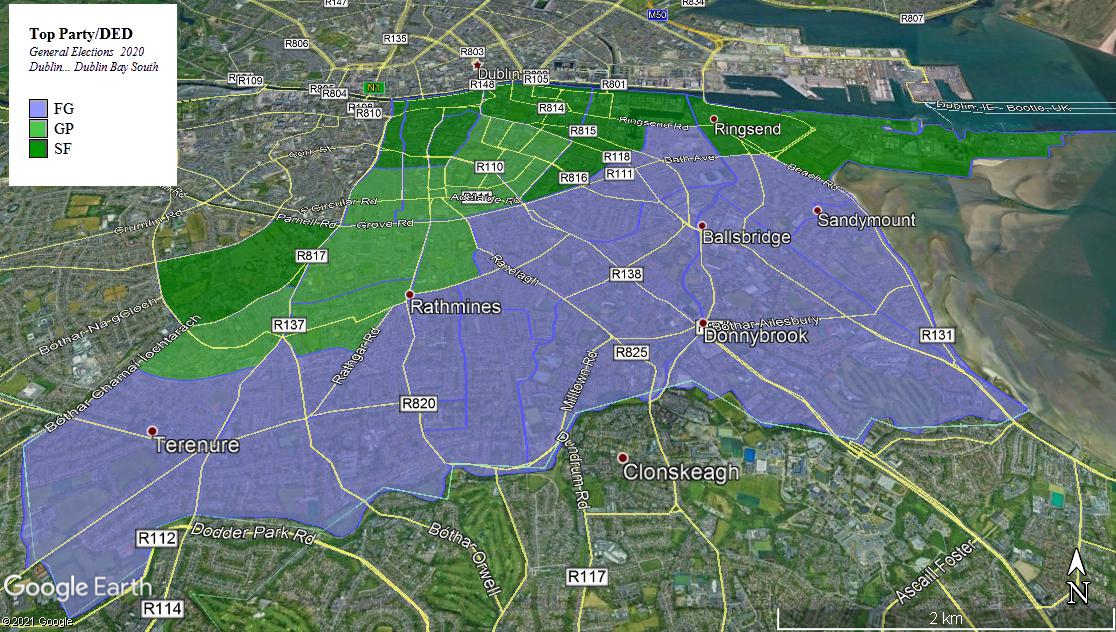
DUBLIN
Despite their vote declining slightly on what they achieved in February, Sinn Féin could expect to gain up to 5 seats in Dublin due to the under-nomination of candidates in February – the most likely gains would be in Dublin Central, Dublin South-Central and Dublin Bay North.
Fianna Fáil – despite being on the same vote level as the Greens – would only take one seat (Dublin Fingal) compared to the latter’s five. There are probably several reasons for this – the Green vote is more highly concentrated in certain constituencies (those with significant middle-class areas), Fianna Fáil ran more candidates, and the Greens are more transfer-friendly.
It is arguable that in the next election – irregardless of their first count vote – the Greens will suffer on transfers due to their participation in this government. It is also conversely arguable that Fianna Fáil might actually at least benefit from a higher transfer rate from Fine Gael.
Fine Gael’s six gains seem comparatively modest given their massive vote increase – FG candidates were runners-up in Dublin Bay North, Dun Laoghaire (where they were not far off 3 out of 4), Dublin Fingal and Dublin Mid-West on the simulated constituency counts.
LEINSTER
Unlike elsewhere, Fianna Fáil losses in Dublin would be kept to a rate proportionate to their vote less – about a third. They would hold two seats in Carlow-Kilkenny, but on the other hand would be left with no seats in Wicklow and Meath East.
With a 15 point rise in their vote, Fine Gael would take seven extra seats, and wouldn’t be far off making two gains in Wicklow. Sinn Féin could be similarly close to taking 3 out of 5 in Louth, although they might find the necessary three-way vote management in a constituency with two geographically distant urban centres.
The Greens would lose both their seats. Labour would retain both theirs.
MUNSTER
Fine Gael’s vote gain might be slightly more modest here, but they would likely double their seats – including a double gain in Waterford.
By contrast Fianna Fáil would only come back with 4 of the 13. Quixotically enough, 2 of those 4 seats would be in Cork South-Central, where the constituency model predicts that the fall-off in the vote of the runner-up party (Greens) combined with the poor vote management of Fine Gael would – just about – allow FF to retain 2. Almost as quixotically, it predicts that FF (to the benefit of FG) would take no seat in Clare despite having a quota between the two candidates. Again the key to understanding this result is vote balance – having a tightly-balanced 2 person ticket is an advantage when you are fighting for two seats, but a disadvantage if you are fighting for one.
As in Leinster, the Greens would lose both their seats – and Labour would retain both theirs.
CONNAUGHT-ULSTER
Sinn Féin would probably take a third seat in Donegal – although it would not be a given. By contrast, they could lose their newly-won Galway-Roscommon seat due to the strength of the Independent vote and the Sinn Féin Surge.